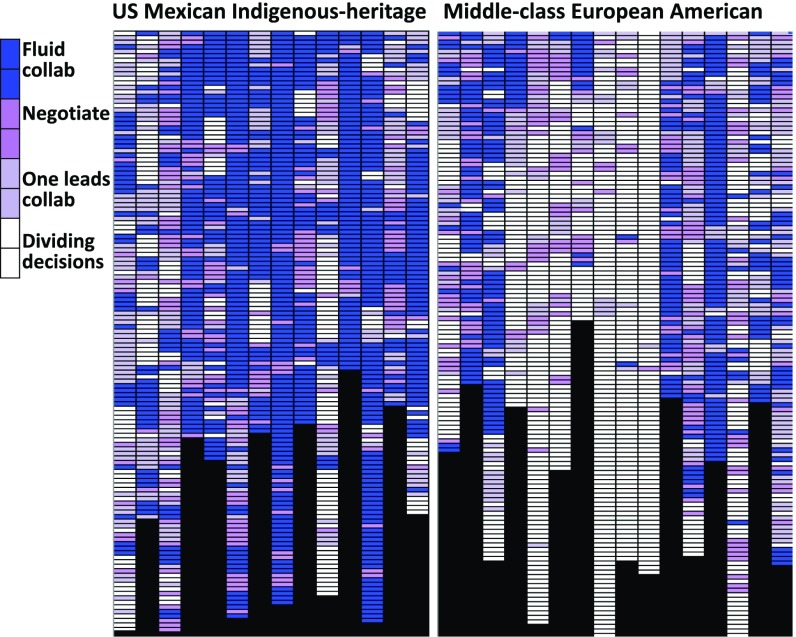
Fig. 2.
Casegraphs showing distinct patterns and variability in working together. Each column is a sibling pair, through the 10-s segments of their planning session. Casegraphs maintain fidelity to individual cases while conveying quantitative information (33).

