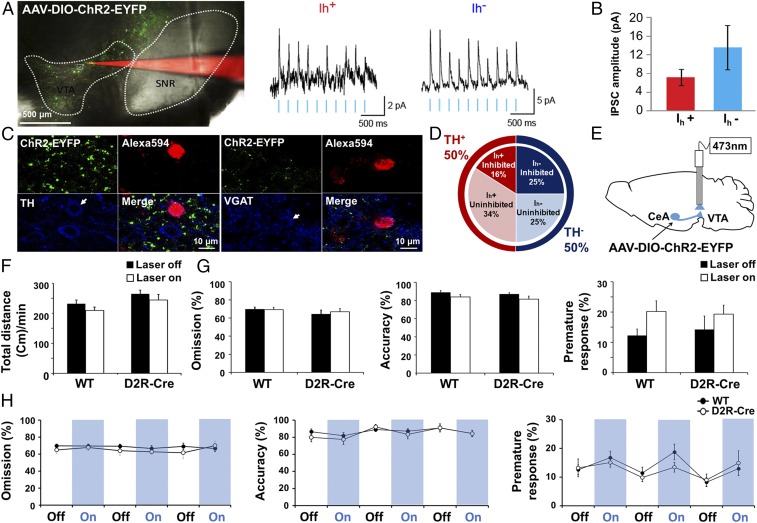
Fig. 4.
D2R-expressing neurons in the CeA → VTA circuit did not regulate the impulsive behavior. (A) Fluorescence image of a patch-clamped neuron (red) and of ChR2-EYFP–positive axon terminals (green) projecting from the CeA to the VTA [Scale bar, 500 µm (Left)] as well as representative recordings of light-evoked IPSCs of Ih+ and Ih− neurons in the VTA (Right). Traces were low-pass-filtered at a cutoff frequency of 140 Hz. (B) Amplitude of photostimulation-evoked IPSCs in Ih+ (n = 9) and Ih− (n = 20) VTA neurons (holding potential, −50 mV). Data were analyzed from eight mice. (C) Confocal images of patch-clamped neurons (arrows; labeled red with Alexa Fluor 594) in the VTA of D2R-Cre mice (TH; n = 8, VGAT; n = 10) injected with AAV-DIO-ChR2-EYFP into the CeA. The neurons were stained with antibodies to TH or to VGAT (blue). (Scale bars, 10 μm.) (D) Proportions of VTA neurons examined (n = 83) that were positive or negative for photostimulation-induced IPSPs, the Ih current, or TH immunoreactivity (n = 24). Data were analyzed from eight mice. (E) Schematic diagram of AAV-DIO-ChR2-EYFP injection into the CeA and implantation of a fiber-optic cannula into the VTA of D2R-Cre mice (D2R-CreCeA→VTA) for experiments shown in F–H. (F) Total travel distance per minute in the open-field test for WT (n = 9) and D2R-CreCeA→VTA (n = 5) mice during laser-off and laser-on (3 min, 5 Hz, 10 mW) periods determined as in Fig. 2F. P > 0.05, genotype × light stimulation interaction; F(1, 24) = 0.00 with two-way ANOVA followed by Bonferroni test. (G) Percentage omission, accuracy, and premature response in the 5-CSRTT for WT (n = 13) and D2R-CreCeA→VTA (n = 7) mice as determined in Fig. 2H. P > 0.05, genotype × light stimulation interaction; F(1, 36) = 0.18 with two-way ANOVA followed by Bonferroni test. (H) Time course omission (%), accuracy (%), and premature response (%) in the 5-CSRTT as in G. All values in the data represent mean ± SEM.

