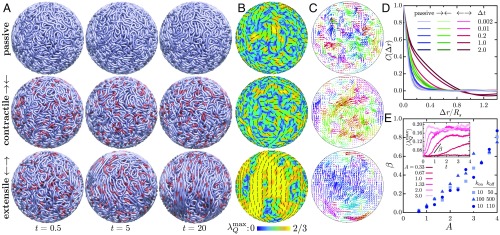
Fig. 3.
(A–C) Simulations of a passive chain (Top) and active chains with contractile (Middle) and extensile (Bottom) dipoles, with N = 5,000 and . In the active cases, , , and . Also see SI Appendix, Movies S4–S7. (A) Fiber configurations at different times with red segments showing instantaneous dipole locations. (B) The nematic structure of the fiber in a shell of thickness on the surface of the confining sphere. Colors show the maximum eigenvalue of the nematic order tensor (i.e., the scalar order parameter), and black segments show the corresponding nematic director. (C) Chromatin displacement maps calculated in a plane across the spherical domain over a time interval . Arrows are color-coded according to the direction of displacement. (D) Average spatial autocorrelation functions of the displacement maps for increasing values of the displacement time . (E) Growth rate of the order parameter as a function of activity for different combinations of and . The growth rate is calculated during the initial exponential increase of , which we average over spherical regions of size (E, Inset).

