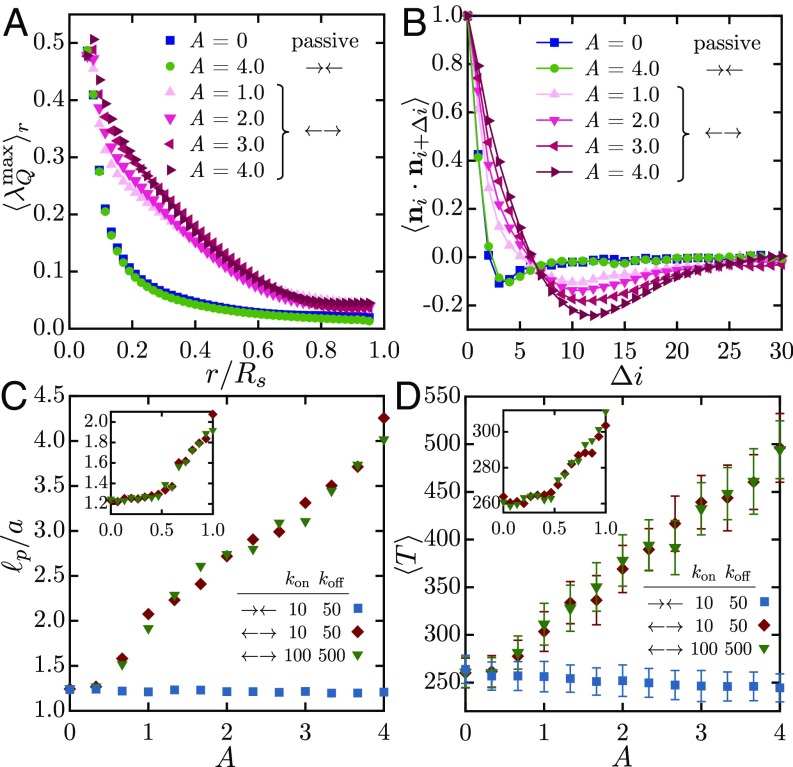
Fig. 4.
(A) The nematic order parameter , averaged over spheres of radius , at late times in simulations of passive, contractile (), and extensile () systems. (B) Autocorrelation of the link orientation vector (where is the link index) as a function of separation distance along the fiber. (C) Effective persistence length as a function of in contractile and extensile systems. (D) Mean scalar tensile force inside the chain in the same systems. The Insets to C and D give more detail in the neighborhood of the bifurcation, which occurs near in excellent agreement with the phase diagram of SI Appendix, Fig. S3.

