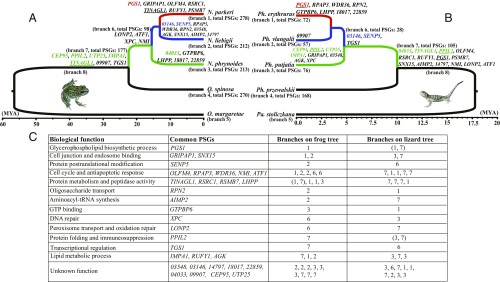
Fig. 1.
Time-scaled phylogenetic trees for frogs (A) and lizards (B) distributed across an elevational gradient of the Qinghai-Tibetan Plateau. Black lineages represent lowland distributions, green lineages represent distributions up to about 2,000 m, blue lineages represent distributions from roughly 2,000–3,500 m, and red lineages represent distributions from about 3,500–4,500 m. The branch number and the number of PSGs are indicated beside each tip or branch of the two trees, and PSGs that evolved in parallel are shown on the respective branches of each tree. (C) All of the parallel PSGs that were identified in both groups of high-elevation species, and their functions (where known), are shown. Parallel PSGs that evolved at the same change in elevational distribution are shown in the respective color of that lineage (green, blue, or red, respectively). Underlined genes showed positive selection on more than one branch of the frog or lizard tree. The functional unknown PSGs are represented by the last five digits of the anole lizard’s ENSEMBL gene identifiers.

