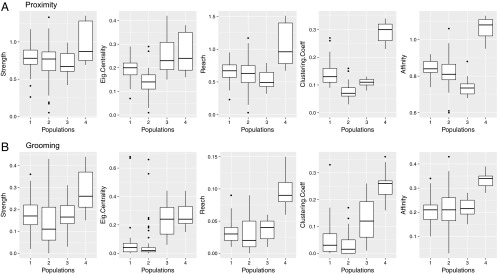
Fig. 3.
(A and B) Social network attributes across the four study populations. Significant differences (P < 0.0001) were found for all attributes except “strength,” some of which were between the larger and smaller populations (e.g., eigenvector centrality) and others independent of population size (e.g., clustering coefficient); also see SI Appendix, Tables S3 and S4. Ranges are represented by the boxes (IQR); medians are indicated by the bold, horizontal lines within the boxes.

