Fig. 2.
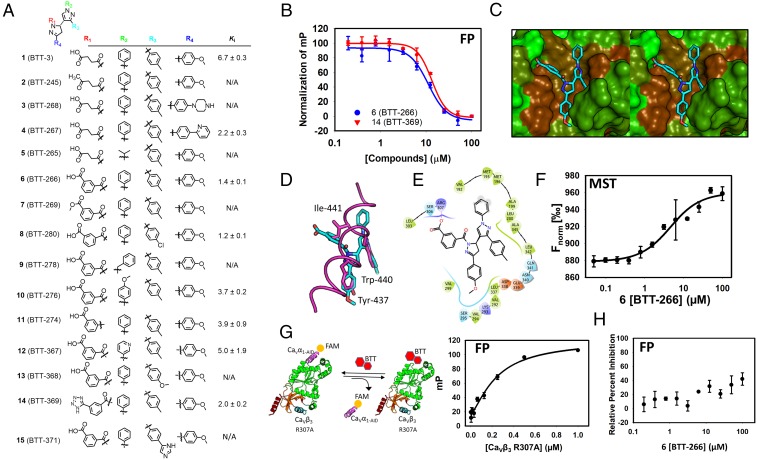
Design and synthesis of a focused library identifies 6 (BTT-266) that inhibits the CaVα⋅CaVβ3 protein–protein interaction. (A) Chemical structure of derivatives that were designed and synthesized based on the structure of 1. (B) The FP assay is used to determine an inhibition constant for 6. (C) Binding mode of 6 to CaVβ3. This model was generated by molecular docking of the compound to the crystal structure of CaVβ3. The compound is shown as capped sticks and is color-coded by atom type (cyan, red, and blue correspond to carbon, oxygen, and nitrogen, respectively). CaVβ3 is shown in a solvent-accessible surface color-coded based on hydrophobicity (green, less hydrophobic; brown, more hydrophobic). (D) The binding mode of 6 superimposed on the binding mode of CaVα1-AID (PDB ID code: 1VYT) shown in magenta tube rendering. Compound 6 is shown in capped-sticks representation color-coded by atom type. Hot spots on CaVα1-AID are shown as magenta capped sticks to illustrate the overlap with substituents on 6. (E) A 2D representation of the binding mode of 6 shown in C and D. The schematic shows the compound chemical structure along with the residues that are involved in intermolecular interactions with the compound. Hydrophobic, positively charged, negatively charged, and polar residues are colored green, blue, red, and cyan, respectively. Solvent-exposed atoms are shown by gray circles in the background. The salt bridge between Arg-307 and the compound is shown by a pink line. (F) The binding curve that emerged from the use of MST to establish direct binding of compound 6. Curve-fitting analysis led to a Kd of 3.6 ± 1.1 µM. (G) An FP assay was developed using the CaVβ3 Arg-307-Ala (R307A) mutant titrated to the CaVα1-AID fluorescently labeled peptide. The binding constant obtained from this analysis is 3.6 ± 1.1 µM. (H) Compound 6 does not inhibit the protein–protein interaction between CaVβ3 Arg-307-Ala as evidenced by a lack of displacement of fluorescently labeled CaVα1-AID bound to the mutated CaVβ3.

