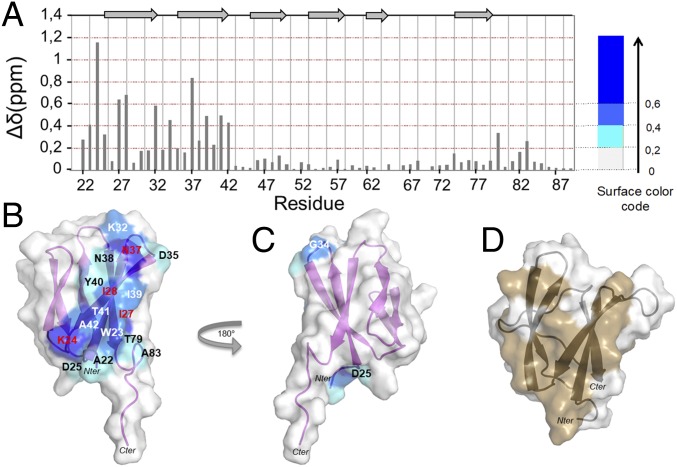
Fig. 3.
AVR1-CO39 binds RGA5HMA through the interface defined by the crystal structure of the complex. (A) Plot of the chemical shift differences (∆ppm) between unbound (R = 0) and RGA5HMA-bound dSP-AVR1-CO39 (R = 2). Chemical shift differences were calculated as the Hamming distance (31), ∆δ(ppm) = I∆δ(1H)ijI + 0.102 × I∆δ(15N)ijI, where ∆δ(1H)ij and ∆δ(15N)ij are the differences of the 1H and 15N chemical shifts at R = 0 and R = 2, respectively. (B) Structure of dSP-AVR1-CO39 showing the chemical shift differences from NMR titration with the following color code: surfaces of residues with ∆δ(ppm) ≥ 0.6 in dark blue (residues in red letter), 0,6 > ∆δ(ppm) ≥ 0.4 in light blue (residues in white letters), and for 0.2 > ∆δ(ppm) ≥ 0.4 in cyan (residues in black letters). (C) 180° rotation of B. (D) Structure of the WT dSP-AVR-Pia with the RGA5HMA interaction surface previously determined by NMR (14) in brown.

