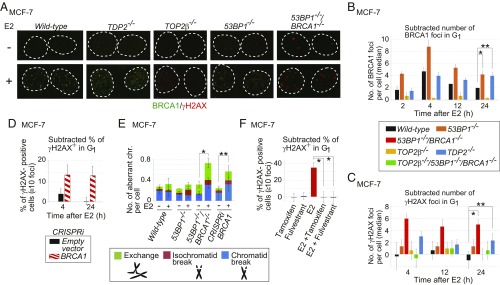
Fig. 1.
E2-induced genomic instability in the BRCA1-deficient MCF-7 cell. (A) BRCA1 and γH2AX foci in serum-starved MCF-7 cells treated with E2 (10 nM) [E2(+)] or DMSO [E2(−)] for 2 h followed by incubation in E2-free medium for 2 h. Dotted lines outline each nucleus. (B and C) The median of the numbers of E2-induced BRCA1 (B) and γH2AX (C) foci in individual MCF-7 cells after 2-h pulse E2 treatment. We subtracted the median number of foci in E2-untreated cells from the median number of foci in E2-treated cells. Actual numbers of foci per cell are shown in SI Appendix, Fig. S3 B and C. Genotypes of the analyzed cells are shown between the graphs. The error bars show SD of three independent experiments. The single and double asterisks in B indicate P < 0.03 and P < 0.02, respectively. The single and double asterisks in C indicate P < 0.04 and P < 0.03, respectively. The P values were calculated by Student’s t test. Representative images of γH2AX foci are shown in SI Appendix, Fig. S3D. (D) Percentage of γH2AX focus-positive cells in CRISPRi-mediated BRCA1-depleted cells. BRCA1-guide RNA (gRNA) vector or empty vector was transiently transfected into MCF-7 cells expressing dCas9-KRAB before E2 treatment (SI Appendix, Materials and Methods and Fig. S4D). A pulse treatment with E2 was done as in B. Focus-positive cells are defined as cells that show at least 10 foci per cell. We subtracted the percentage of untreated focus-positive cells from the percentage of treated focus-positive cells. (E) E2-induced chromosome aberrations in mitotic chromosome spreads. Following 24-h incubation with media containing charcoal-filtered serum, cells were further incubated in media containing charcoal-filtered serum in the absence (−) or presence (+) of E2 (10 nM) for 36 h and then immediately subjected to chromosome analysis. The y axis shows the number of mitotic chromosome aberrations: exchange, isochromatid break (both sister chromatids broken at the same site), and chromatid break (one of two sister chromatids broken). Error bars were plotted for SD from three independent experiments. At least 50 mitotic chromosome spreads were analyzed for each experiment. The single and double asterisks indicate P < 0.02 and P < 0.03, respectively, calculated by Student’s t test. (F) The inhibitory effect of fulvestrant (100 nM) and tamoxifen (1 μM) on E2-induced γH2AX-focus formation in 53BP1−/−/BRCA1−/− cells. Cells were treated with the indicated reagents for 2 h, followed by incubation in drug-free media for an additional 2 h. Error bars indicate SD calculated from three independent experiments. The asterisks indicate P < 0.003, calculated by Student’s t test.

