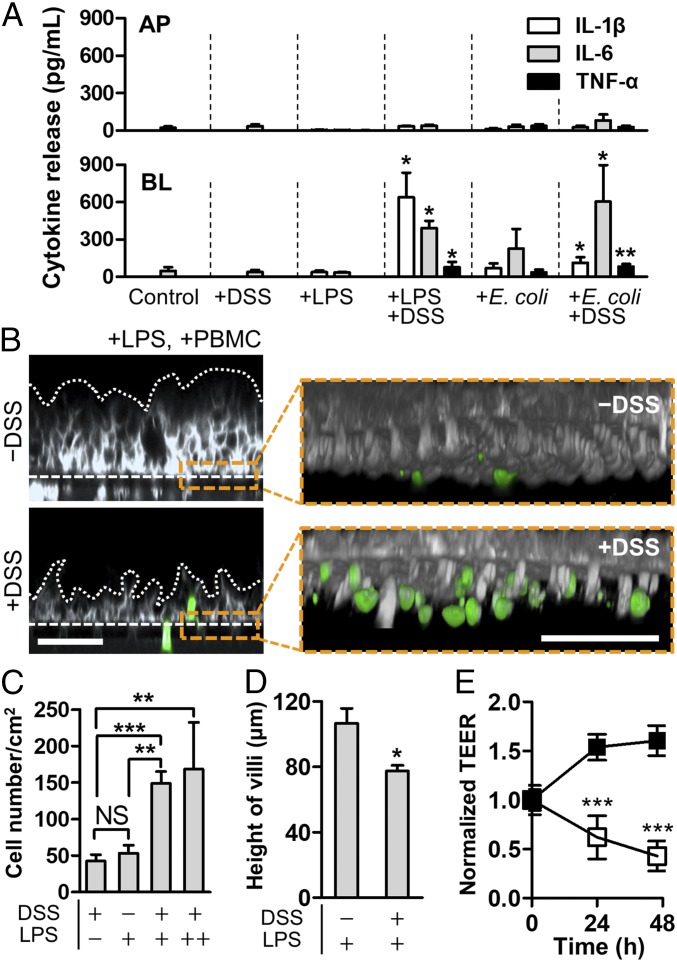
Fig. 4.
Pathophysiological cross-talk between the barrier-impaired villus epithelium, gut microbiome or microbial LPS, and immune components exerts inflammatory responses. (A) Directional secretion of proinflammatory cytokines after costimulation of LPS (10 ng/mL) or E. coli cells (1 × 10⁶ cfu/mL; MOI, 0.25) with PBMC (4 × 10⁶ cells per milliliter) for 24 h in the presence or the absence of DSS treatment (n = 4). Statistical analysis was performed compared with the control group. (B) A cross-sectional view of the villus morphology (Left) and recruited immune cells (Right Inset) in response to apical DSS treatment. The villus epithelium was challenged to LPS (10 ng/mL) in the presence or the absence of DSS for 48 h, and then PBMC (4 × 10⁶ cells per milliliter) was added to the BL side for 24 h. Villi were visualized by staining the plasma membrane of epithelial cells (gray) and PBMC (green). White dotted lines and dashed lines represent the contour of the villus epithelium and the location of porous membranes, respectively. (C) Quantification of the number of recruited PBMCs on the basolateral surface of the villus epithelium. In the LPS panel, “+” indicates the physiological concentration of LPS (10 ng/mL), whereas “++” represents the extremely high concentration of LPS (5 μg/mL) (n = 8). (D) Height of villi in response to the DSS treatment in the presence of LPS at the physiological level (10 ng/mL). (E) Effect of DSS-mediated barrier disruption of villus epithelium in response to LPS at physiological concentration (10 ng/mL). Intestinal barrier function displayed by the normalized TEER was declining in the presence of both DSS and LPS (open square), whereas the presence of LPS alone did not compromise any barrier function (filled square). All of the experimental groups include PBMCs (4 × 10⁶ cells per milliliter). (Scale bars, 50 μm.) NS, not significant. *P < 0.05, **P < 0.001, ***P < 0.0001.

