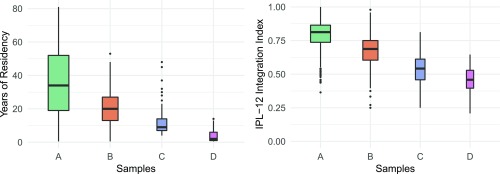
Fig. 1.
Box plots show for four immigrant samples A–D the distributions of residency (Left) and IPL-12 Integration Index scores (Right). The samples are ordered by decreasing expected levels of integration. The measured integration levels based on the IPL-12 Integration Index reproduce the ordering of the samples from highest to lowest expected levels of integration. Box width is proportional to sample size.

