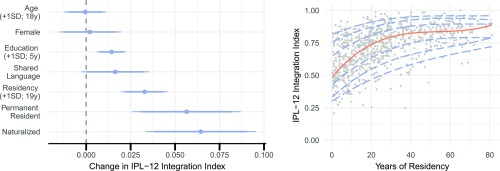
Fig. 2.
The IPL-12 Integration Index scores correlate with established predictors of integration. (Left) Marginal effects from a regression of IPL-12 Integration Index scores on predictors of integration. Circles indicate point estimates and lines 90% and 95% confidence intervals. (Right) A scatter plot between the IPL-12 Integration Index scores and years of residency. Lines show how the percentiles of the IPL score distribution change with residency. Lines are drawn for the 5th, 10th, 25th, 50th (orange), 75th, 90th, and 95th percentiles.

