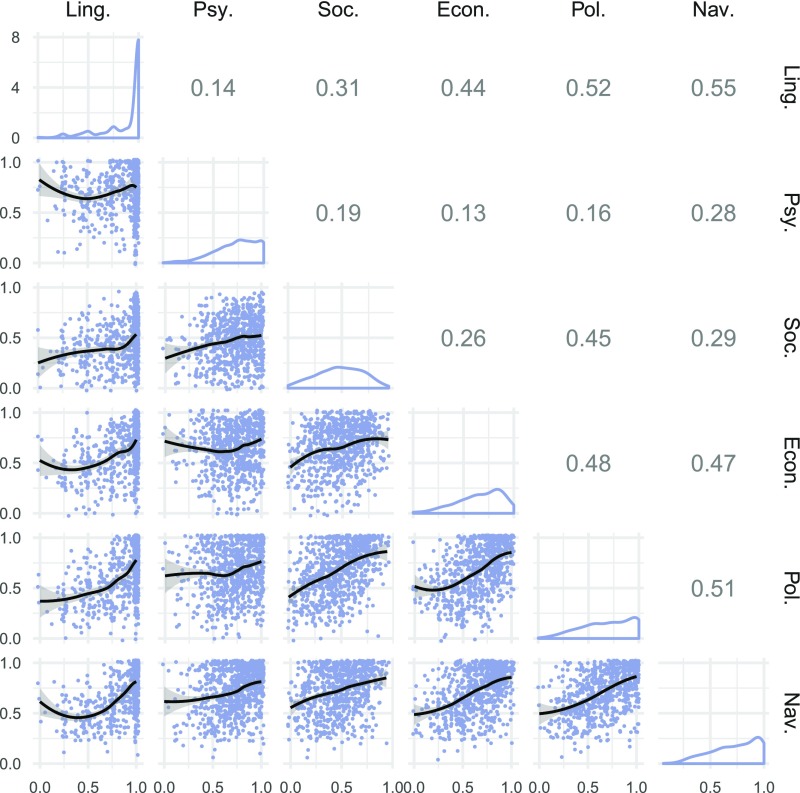
Fig. 3.
Scatter-plot matrix for the six dimensions of integration as measured by the IPL-24 Integration Index (pooled sample, N = 787): economic (Econ.), linguistic (Ling.), navigational (Nav.), political (Pol.), psychological (Psy.), and social (Soc.) integration. Panels in Middle diagonal show the histograms of the marginal distributions, panels in Upper Right diagonal show the bivariate correlation coefficients, and panels in Lower Left diagonal show the scatter plots with Loess lines (black).

