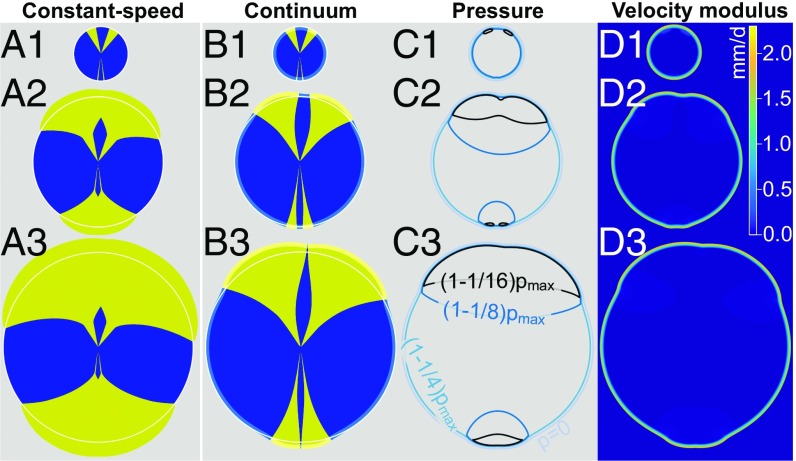
Fig. 3.
The constant-speed model inspired by geometrical optics (A1–A3) and the continuum model (B1–B3) make different predictions for the competition of yeast strains in growing colonies. Both models were integrated numerically, starting from the same initial condition shown in A1 and B1. The constant-speed model (A1–A3) fails to reproduce the thin, persistent filaments observed experimentally (Fig. 1 A–A2), but such filaments are seen for the blue strain in the continuum model (B1–B3). The opening angle of yellow sectors increases faster in the constant-speed model (A1–A3) than in the continuum model (B1–B3), consistent with the experimental observations in Fig. 4. White contours are circles fit to the blue-strain outer profile far from yellow sectors; they highlight the displacement of the blue strain close to yellow sectors in the continuum model. The growth layer is shown in B1–B3 using light-yellow and light-blue colors. C1–C3 show pressure contours and , where and was evaluated at each time step. D1–D3 show the local velocity modulus in the continuum model simulations and highlight that the displacement of strains takes place mostly within the growth layer. Model parameters are = 1.89 mm/d, = 2.33 mm/d, and = 290 μm.

