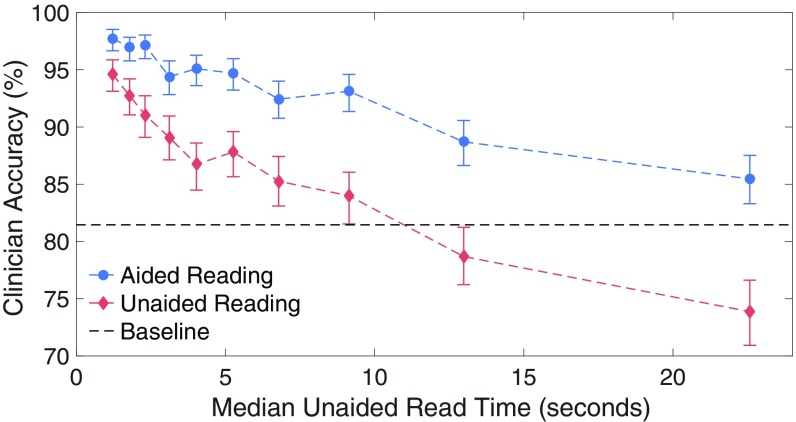
Fig. 5.
Each point represents a bin containing one-10th of the radiographs used in the experiment. The horizontal location of a point indicates the median unaided response time in seconds for the radiographs within the bin. The vertical location of a point indicates the across-clinician average diagnostic accuracy on the radiographs within the bin. The difference in accuracy between the aided and unaided reading conditions increases with unaided reading time, which is a proxy for the radiograph’s difficulty. The dashed horizontal black line indicates the accuracy that a clinician would have achieved had he or she reported “no fracture” on every radiograph. The aided reading condition never has an average accuracy worse than baseline guessing.

