Fig. 1.
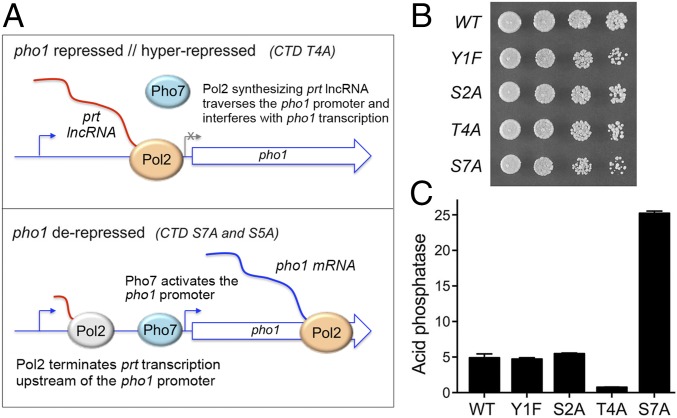
CTD control of phosphate homeostasis in phosphate-replete cells. (A) Models for the pho1 repressed/hyperrepressed (Upper) and derepressed (Lower) states of the prt–pho1 locus under phosphate-replete conditions. (B) Growth of S. pombe strains with the indicated full-length rpb1-CTD alleles (see SI Appendix, Fig. S1 for CTD amino acid sequences). Cells were inoculated in YES broth and grown at 30 °C. Exponentially growing cultures were adjusted to A600 of 0.1 and 3-µL aliquots of serial fivefold dilutions were spotted on YES agar and then incubated at 30 °C. (C) The indicated rpb1-CTD strains were grown to A600 of 0.5–0.9 in liquid culture in YES medium at 30 °C. Cells were harvested, washed with water, and assayed for Pho1 acid phosphatase activity by conversion of p-nitrophenylphosphate to p-nitrophenol. Activity is expressed as the ratio of A410 (p-nitrophenol production) to A600 (input cells). Each datum in the bar graph is the average of assays using cells from at least three independent cultures ± SEM.

