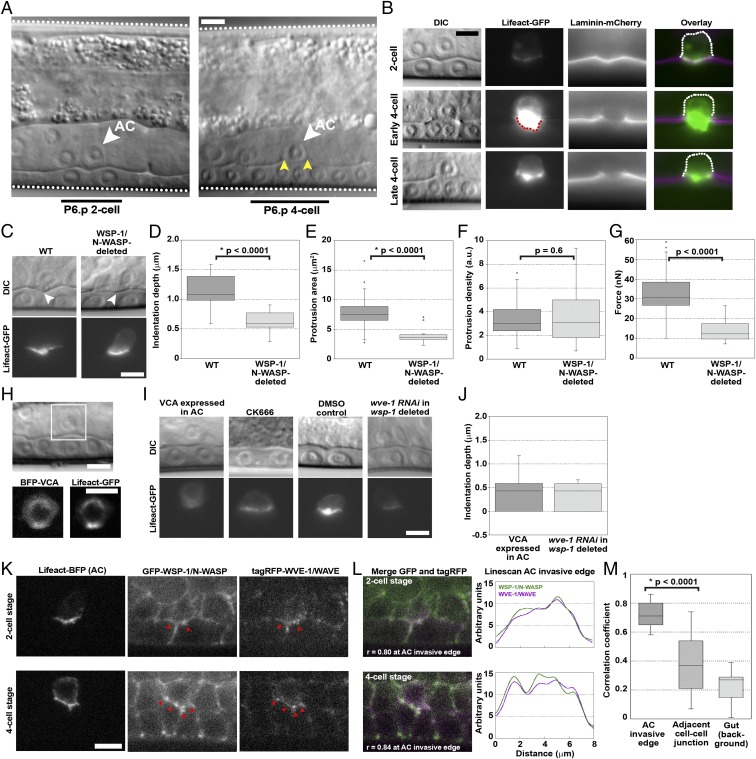
Fig. 1.
The invading AC exerts force via an Arp2/3 complex-dependent protrusion, dependent on both WSP-1/N-WASP and WVE-1/WAVE. (A) AC invasion as viewed by DIC microscopy. The AC (white arrowheads), the body wall of the worm (white dotted lines), P6.p 2-cell and 4-cell stage (black bars) and the break in the phase dense line of the BM (yellow arrowheads) are marked. (B) Actin in the protrusion, observed by AC-specific expression of Lifeact-GFP over the course of invasion of the BM, observed by laminin-mCherry. Scaling is not adjusted in the single-channel images, showing the increase of F-actin in the AC (red dotted line). Once the BM gap is as wide as the AC, at the late P6.p 4-cell stage, the protrusion diminishes and retracts. The back of the cell is immobile (dotted white line). (C) The AC indents the BM (white arrowheads) before invasion, with an actin-rich protrusion. WSP-1/N-WASP deletion reduces the indentation depth and the actin protrusion size, although the density remains unchanged. (D–F) Quantification of indentation depths, and the sizes and densities of actin protrusions. (G) Estimated forces produced by the AC in WT and WSP-1/N-WASP-deleted conditions. (H) The VCA domain of WSP-1/N-WASP, labeled with BFP and expressed specifically in the AC, completely blocks invasion and perturbs actin protrusion formation. (I) Sample images of indentations and actin protrusions under different Arp2/3 complex perturbations. (J) Quantification of indentations depths of VCA-expressing ACs and wsp-1-deleted ACs subjected to wve-1 RNAi. (K) Endogenous GFP-tagged WSP-1/N-WASP and endogenous tagRFP-tagged WVE-1/WAVE are present in the AC at the invasive cell membrane at the P6.p 2-cell and 4-cell stage, colocalized with Lifeact-BFP expressed in the AC. Red arrowheads in K indicate spots of colocalization of WSP-1/N-WASP and WVE-1/WAVE signal. (L) Colocalization of WSP-1/N-WASP and WVE-1/WAVE at the AC invasive membrane is also observed in the merge (white indicates colocalization), and the coincidence of peaks in the linescans. (M) Correlation coefficients to quantify colocalization along the AC invasive membrane at the P6.p 4-cell stage, at a non-AC cell-cell junction in the vulval tissue and in a featureless region in the gut where colocalization can be presumed to be noise (n = 17). (B, C, and I) Epifluorescence microscopy. (H, K, and L) Spinning disk microscopy. (Scale bars, 5 μm.)

