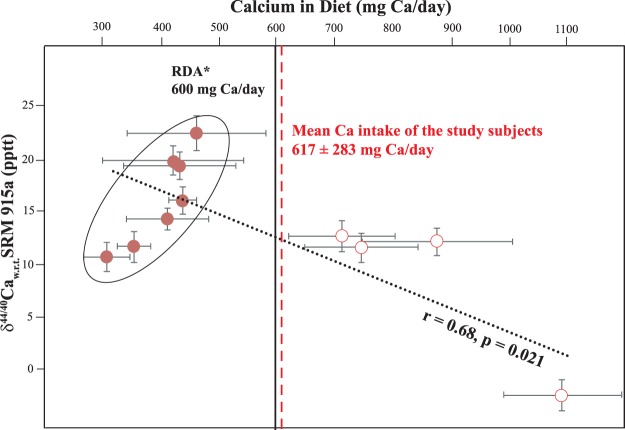
Figure 2.
Baseline variability of δ44/40Ca in urine of all the subjects (n = 11) are plotted against Ca intake obtained from dietary recalls. A weak but significant correlation indicating depletion in δ44/40Ca with increased intake of Ca in diet is seen, with presence of two distinct dietary clusters. The mean Ca intake along with the *Recommended Dietary Allowance24 for the study group is also given for reference. Within the low Ca intake cluster (marked in the figure), δ44/40Ca and the amount of Ca exhibit a positive correlation.

