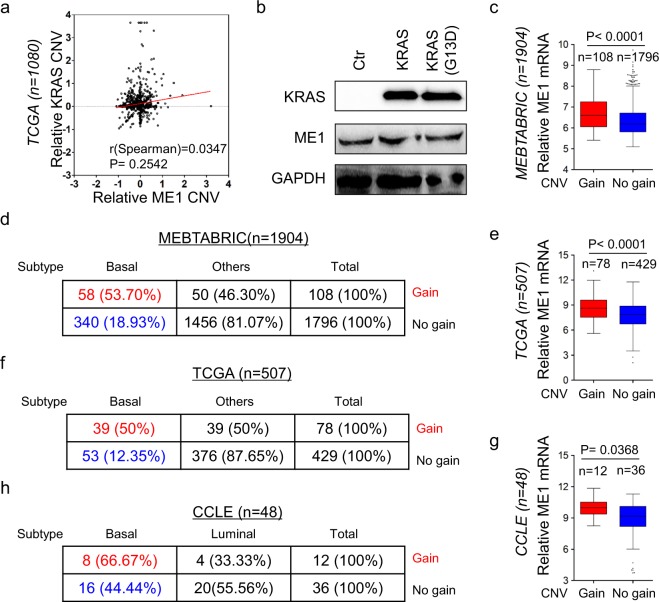
Figure 2.
ME1 copy number amplification associates with ME1 expression and BLBC subtype. (a) Analysis of TCGA dataset for the CNVs of ME1 and TCGA. The relative CNV of ME1 was plotted against that of KRAS. Correlations were analyzed using Spearman’s rank correlation test. (b) Expression of ME1 and KRAS in T47D cells was analyzed by western blotting. (c) Box-plots indicated the association of ME1 expression with its copy number status (gain or no gain) in breast cancer from MEBTABRIC dataset. (d) Analysis of MEBTABRIC dataset for the association of copy number status of ME1 and tumor subtype. (e) Box-plots indicated the association of ME1 expression with its copy number status (gain or no gain) in breast cancer from TCGA dataset. (f) Analysis of TCGA dataset for the association of copy number status of ME1 and tumor subtype. (g) Box-plots indicated the association of ME1 expression with its copy number status (gain or no gain) in breast cancer from CCLE dataset. (h) Analysis of CCLE dataset for the association of copy number status of ME1 and tumor subtype.

