Figure 3.
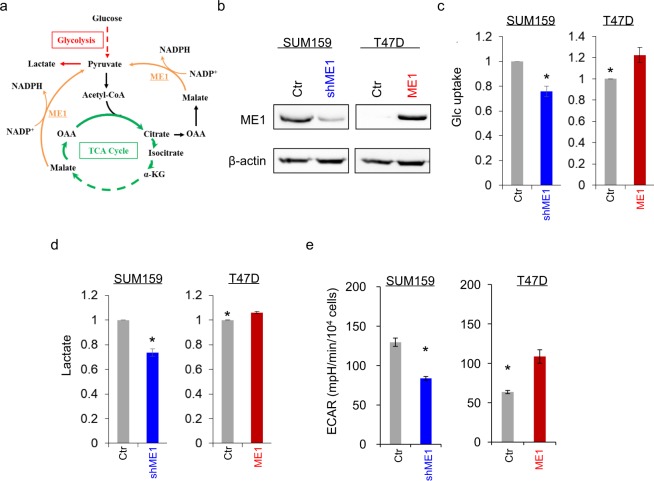
ME1 induces cell glucose uptake and lactate production. (a) Schematic diagram showing ME1-mediated metabolic pathways. (b) Stable transfectants with empty vector or knockdown of ME1 expression were established in SUM159 cells, and stable clones with empty vector or ME1 expression were generated in T47D cells. ME1 expression in these cells was examined by western blotting. Actin was used as a loading control. (c) The level of glucose uptake was measured in SUM159 cells with stable empty vector or knockdown of ME1 expression (left panel) as well as T47D cells with stable empty vector or ME1 expression (right panel). The level of glucose was shown in the bar graph (mean ± SD in three separate experiments). *p < 0.05 by Student’s t-test. (d) The content of lactate from cell lines in (c) were analyzed as described in the Materials and Methods. The level of lactate is shown in the bar graph (mean ± SD in three separate experiments). *p < 0.05 by Student’s t-test. (e) ECAR in SUM159 cells with stable empty vector or knockdown of ME1 expression (a) as well as T47D cells with stable empty vector or ME1 expression (b) was measured by Seahorse XF96 Extracellular Flux Analyzer (mean ± SD in three separate experiments).

