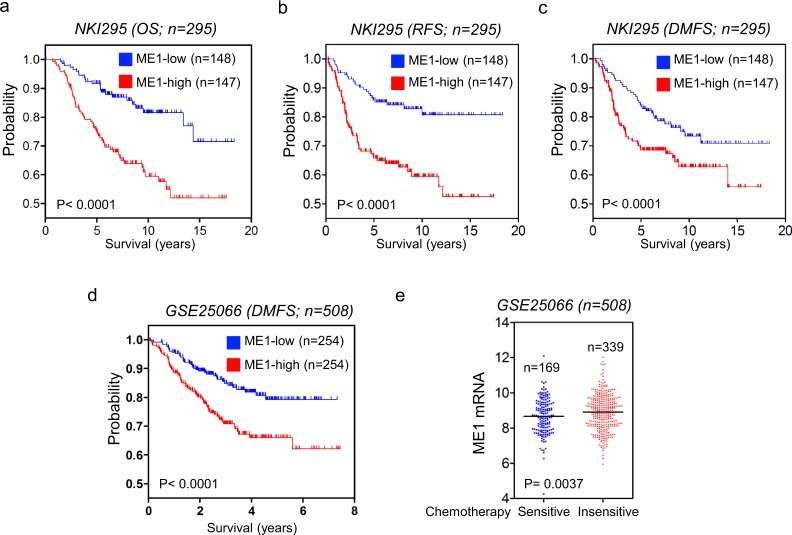
Figure 7.
ME1 expression predicts poor clinical outcome. (a–c) Kaplan-Meier survival analysis for OS (a), RFS (b) and DMFS (c) of patients in the NKI295 dataset according to ME1 expression status. The p value was presented using the log-rank test. (d) Kaplan-Meier survival analysis for DMFS of patients in the GSE25066 dataset according to ME1 expression status. The p value was presented using the log-rank test. (e) Analysis of GSE25066 dataset for the relationship between ME1 expression and chemotherapy sensitivity.

