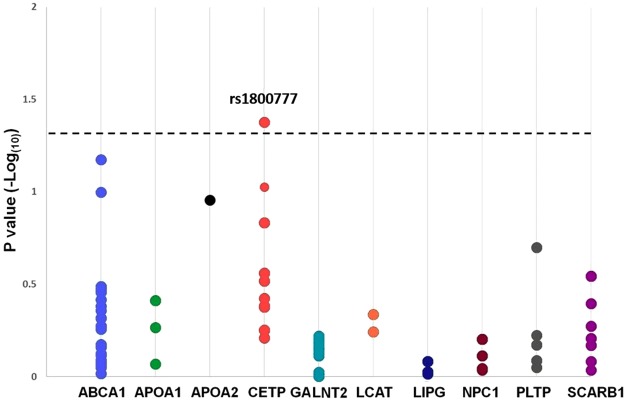
Figure 1.
Associations between HDL-C levels at sepsis vs. genetic variations per genes analyzed. Plots represent the corrected P value (Benjamini-Hochberg correction with a false discovery rate cutoff of 0.05) per each variant. X-axis: genetic variations analyzed per gene; Y-axis: P values (−log(10)) per each genetic variant; The horizontal dotted line represents the −log(10) for the corrected P value of 0.05. The candidate variant rs1800777 was the only one that showed a statistically significant association with HDL-C levels measured at sepsis admission (P = 0.042). Some plots represent overlapped P values of 2 or more genetic variants.

