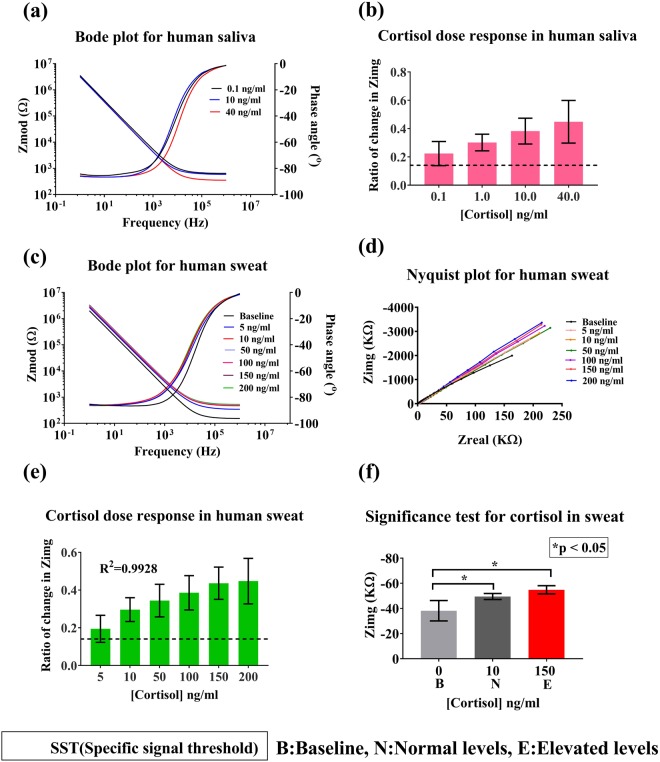
Figure 4.
Analysis of sensor performance in saliva and sweat. (a) Bode phase and magnitude plot for human saliva. (b) Calibration dose response of cortisol spiked in saliva plotted as change in imaginary impedance (Zimg) from baseline against cortisol concentration. (c) Bode phase and magnitude plot for human sweat. (d) Nyquist plot for human sweat. (e) Calibration dose response study for cortisol spiked in human sweat. (f) Statistical analysis for significance in impedance change from baseline for sweat.

