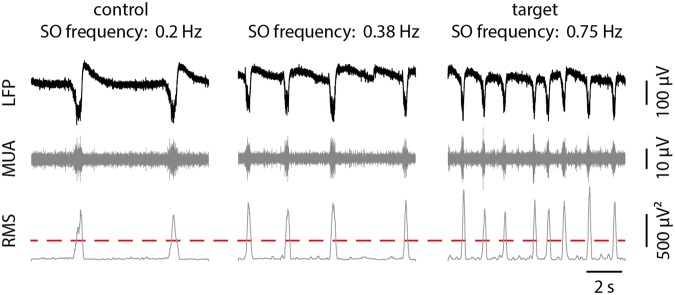
Figure 7.
Real-time signal acquisition, filtering and root mean square (RMS) calculation. From left to the right, note the three different time frames with increasing current stimulation, achieving higher SO frequency. Stimulation protocol applied in in vitro experiments consisting in a 60 s pulse train stimulation followed by a 20 s pause. The averaging window used to estimate slow oscillation frequency lasts 40 s. By modulating the stimulation current, it is possible to reach the target SO frequency, thus demonstrating the potentialities of the Corticonic system in closed-loop applications. In raw LFP signal traces, several Up states can be observed. In order to estimate the SO frequency, the signal RMS is calculated in the MUA band.

