Figure 1.
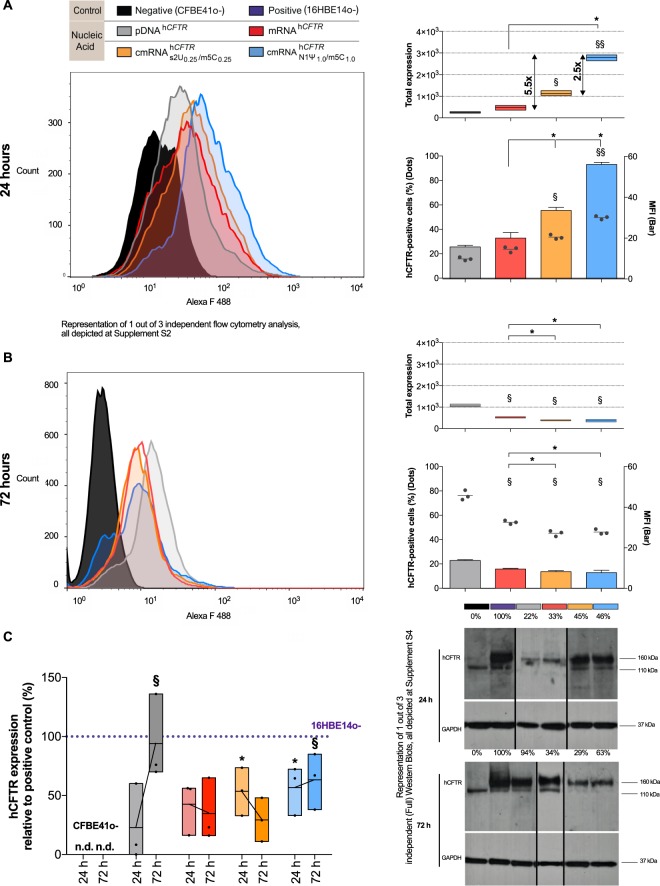
(c)mRNAhCFTR and pDNAhCFTR mediated expression of hCFTR in vitro (A) Total expression of hCFTR (calculated by multiplying positive cells (dots) and MFI (bars)) 24 h after transfection with 1 µg (c)mRNAhCFTR and equivalent nmols of pDNAhCFTR detected by flow cytometry. (B) Total expression of hCFTR 72 h after transfection with 1 µg (c)mRNAhCFTR and equivalent nmols of pDNAhCFTR detected by flow cytometry. (C) Western Blots, semi-quantifying human CFTR in transfected CFBE41o- cells, normalized to GAPDH and put relative to CFTR levels in 16HBE14o- cells. Blot section cropped from different blots are delineated with clear dividing lines (black) and full blot of same exposure time (30 mins) are depicted in Supplement Fig. S4. All bar graph data are depicted as means ± SDs while box plots data are depicted as the means ± minimum to maximum values. *P ≤ 0.05 versus unmodified mRNAhCFTR; §P ≤ 0.05 and §§P ≤ 0.01 vs. pDNAhCFTR.

