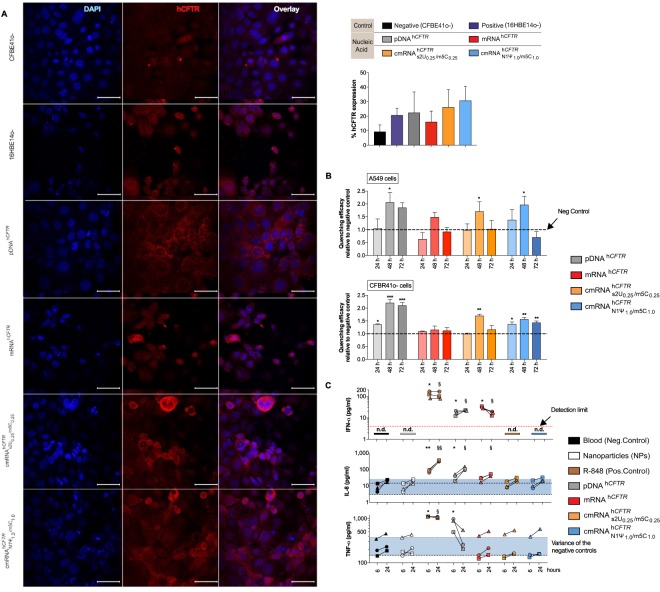
Figure 2.
(c)mRNAhCFTR and pDNAhCFTR mediated expression of hCFTR by immunofluorescence and functional hCFTR in vitro and immunogenicity in human whole blood. (A) Detection of hCFTR protein by immunofluorescence (after 24 h), percent of hCFTR expression in pDNAhCFTR or (c)mRNAhCFTR transfected CFBE41o- cells compare to untransfected CFBE41o- and 16HBE14o- cells. Image J has been used for calculating means ± SDs of hCFTR positive cells; (B) Quenching efficacy of pDNAhCFTR or (c)mRNAhCFTR transfected CFBE41o- and CFTR null A549 cells relative to un-transfected controls was measured at 24 h, 48 h and 72 h post-transfection. *P ≤ 0.05 versus un-transfected controls; (C) 2 ml whole blood, each from three different healthy human donors, were incubated with either R848 (1 mg/ml) or 7 pmol pDNAhCFTR or 7 pmol (c)mRNAhCFTR (providing the same total number of nucleic acid molecules) and NPs at a 1:10 ratio; after 6 h and 24 h the immune response was determined by ELISA in the sera; The blue area represents the variance of the negative controls which are biological replicates. n.d., not detectable and red dotted lines mark the detection limit as specified in the respective ELISA kit. All bar graph data are depicted as means ± SDs while box plots data are depicted as the means ± minimum to maximum values. *and §P ≤ 0.05 (§§P ≤ 0.01) versus control at 6 h and 24 h, respectively.

