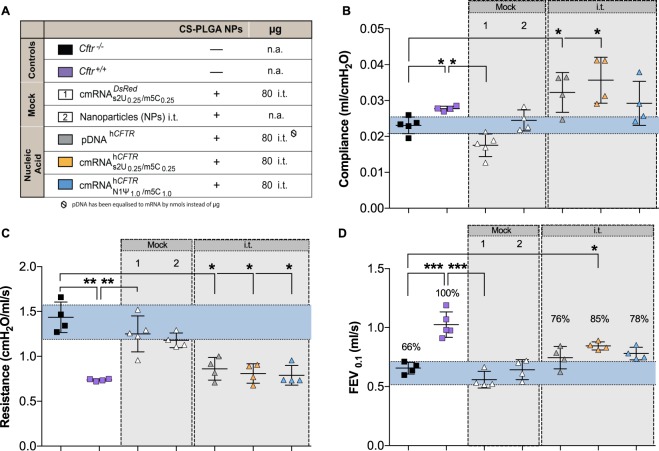
Figure 4.
In vivo lung function measurements in cmRNAhCFTR and pDNAhCFTR treated Cftr−/− mice by i.t. route. All mouse groups utilized in (B–D) are color-coded for their treatment schemes (A), including dosage and application routes. (B–D) Precision in vivo lung function measurements covering all relevant outcome parameters on Cftr−/− mice treated twice via i.t route and measured 72 hours after the 2nd instillment; n = 4–7 mice per group. The blue area represents the variance of the negative controls which are biological replicate. Data represent the means ± SD on compliance, resistance and Forced Expiratory Volume in 0.1 seconds (FEV0.1). *P ≤ 0.05; **P ≤ 0.01 and ***P ≤ 0.001 versus untreated Cftr−/− mice.

