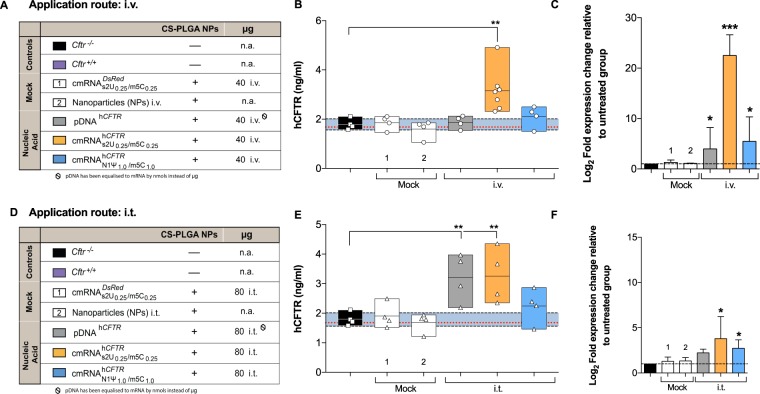
Figure 6.
Expression of hCFTR protein in mouse lungs and delivery of cmRNAhCFTR and pDNAhCFTR in lungs. (A,D) All mouse groups, particles and particle combinations depicted in the study plan are color-coded for their treatment schemes, including dosage and application routes. (B,E) hCFTR ELISA, detecting specifically human CFTR, was performed on lung preparations at day 6 from Cftr−/− mice treated twice via i.v. (B) or i.t. (E) route and measured 72 hours after the 2nd instillment (endpoint); the same n = 4–7 mice per group were used. (C,F) Relative amounts of differently modified hCFTR mRNAs in the lungs applied i.v. or i.t., then determined by RT-quantitative PCR, compared to untreated Cftr−/− mice (*P ≤ 0.05); n = 4–7 mice per group. All bar graph data are depicted as means ± SDs while box plots data are depicted as the means ± minimum to maximum values. The blue area represents the variance of the negative controls which are biological replicates. *P ≤ 0.05; **P ≤ 0.01 and ***P ≤ 0.001 versus untreated Cftr−/− mice.

