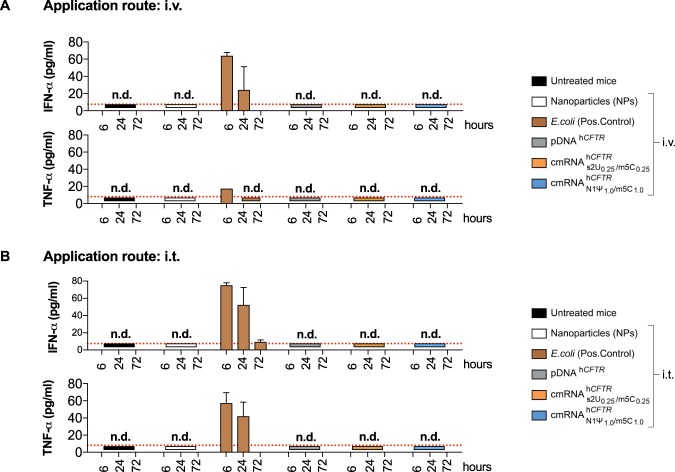
Figure 7.
(c)mRNAhCFTR and pDNAhCFTR mediated immunogenicity in vivo Mice were i.v. or i.t. injected with a mix of (c)mRNA and NPs at a 1:10 ratio and ELISAs were performed post-i.v./i.t.-injection at three different time points. n.d., not detectable. The red dotted lines in (A,B) mark the detection limit as specified in the respective ELISA kit. All bar graph data are depicted as the means ± SD and box plots data are represented as the means ± minimum to maximum values.

