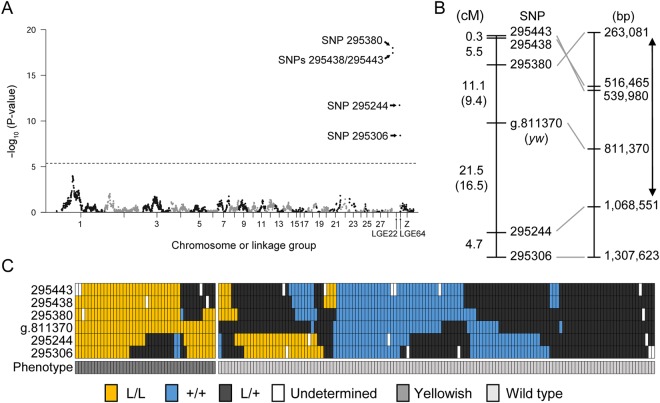
Figure 2.
Case-control association test and genetic mapping. (A) Manhattan plot showing the association between SNP markers on LGE22 and plumage phenotypes. The horizontal axis shows map positions (cM) of SNP markers on each chromosome or linkage group, and the vertical axis shows the negative logarithm of the unadjusted P-value for each SNP marker. The dashed line shows the level of Bonferroni-corrected 1% significance. The top three SNP P-values are 5.1 × 10⁻²² in SNP 295380, 9.8 × 10⁻²⁹ in SNP 295438, and 3.5 × 10⁻¹⁸ in SNP 295443. (B) Locations of SNP markers and the yw locus on the genetic map. Names of SNP markers are shown in the middle; genetic distances between these SNP markers are shown in the left; nucleotide positions of these SNP markers in the NC_029544.1 reference genome assembly (Coturnix japonica 2.0) are shown in the right. Genetic distances between the yw locus and its flanking markers, which were calculated only using F2 individuals exhibiting yellowish plumage, are shown in parentheses. Two direction-arrow indicates the causative region. The SNP at the site of the nonsense mutation is indicated by ‘g.811370’. It should be noted that the order of SNPs 295380, 295438, and 295443 was inverted between the genetic map and the reference genome assembly. (C) Genotypes and phenotypes of 181 F2 offspring. Rectangles indicate genotypes of SNP markers and phenotypes of F2 individuals. Yellow, homozygous mutant genotype (L/L); blue, wild-type genotype (+/+); dark grey, heterozygous genotype (L/+); white, undetermined genotype; grey, yellowish plumage; light grey, wild-type plumage. The genotype and phenotype of each F2 individual is represented as a column of rectangles.

