Figure 4.
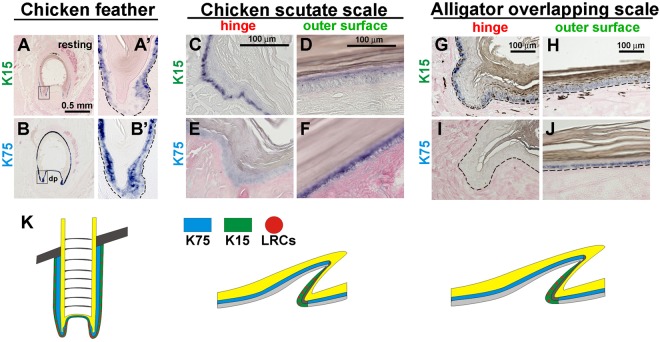
Expression of the stem cell marker, K15 and differentiation marker, K75 in chicken and alligator scales. (A,A’) Expression of K15 in resting phase feather follicles. (B,B’) Expression of K75 in resting phase feather follicles. (C–F) Chicken scutate scales. (C,D) Expression of K15 in chicken scutate scales. (C) Hinge; (D) outer surface. (E,F) Expression of K75 in chicken scutate scales. (E) Hinge; (F) outer surface. (G–J) Alligator overlapping scales. (G,H) Expression of K15 in alligator overlapping scales. (G) Hinge; (H) outer surface. (I,J) Expression of K75 in alligator overlapping scales. (I) Hinge; (J) outer surface. Note K15 is positive in the hinge basal layer (C,G) whereas K75 is positive in the outer surface suprabasal layer (F,J). (K) Schematic drawing of the distribution of K15 (green), K75 (blue) and LRCs (red dot) in feathers (resting stage) and scales. dp, dermal papilla.

