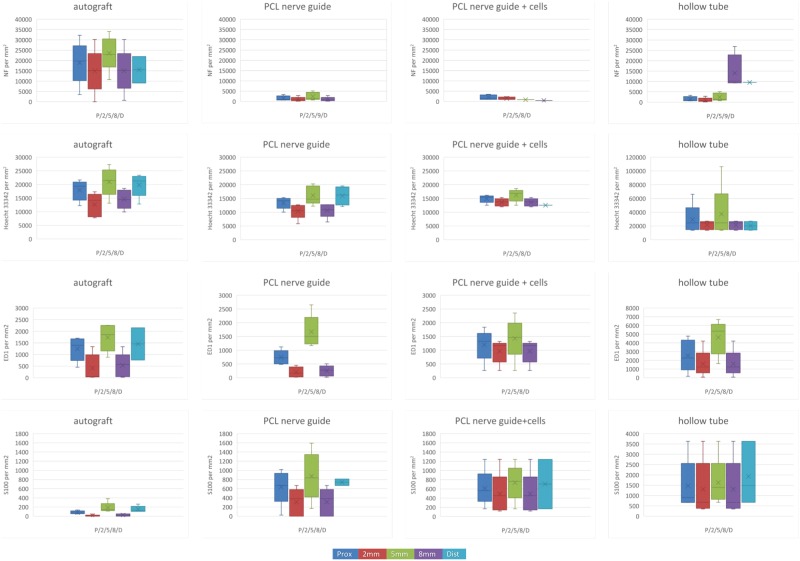
Figure 4.
Data from the PCL nerve guide study visualized by boxplots. Boxes indicate median values, 25- and 75 percentiles; and whiskers indicate minimum and maximum values. (A) NF stainable structures; (B) Hoechst 33342 stained nuclei; (C) ED1 stainable structures; (D) S-100 stainable structures; all determined by counting at photographs of cross sections taken proximally, at 2,5,8 mm from the site of the proximal suture, and distal to the lesion. To avoid cluttering, the detailed data are found in the Supplemented Table S1. Hollow tube (right panel) is presented with a different scale, and some observations in this group are based on a single specimen. Note that there are less S-100 stainable structures at 8 mm in autograft group than in the PCL nerve guide.

