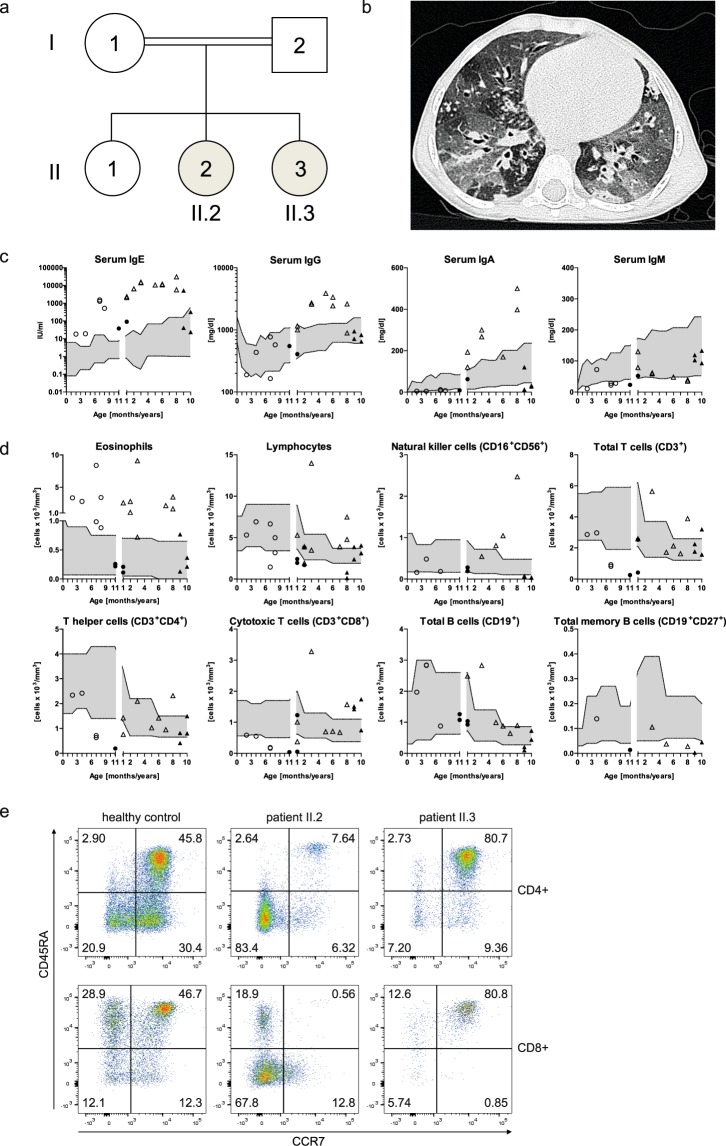
Figure 1.
Pedigree, clinical and immunologic presentation of the two affected siblings. (a) Pedigree of the investigated consanguineous family of the two affected siblings: II.2: index patient; II.3: second affected child. (b) Chest CT scan of patient II.2 at 3.5 years of age with areas of ground glass opacities, air trapping, multiple irregular nodular opacities (tree-in-bud sign), and bilateral bronchiectasis representing lung parenchyma destruction. (c) Serum immunoglobulin levels, (d) absolute numbers of eosinophil, lymphocyte and lymphocyte subsets of patient II.2 (triangles) and patient II.3 (circles) before (open symbols) and after HSCT (black filled symbols) compared to age-related normal range (gray filled area). (e) Representative flow cytometric plots showing CD4+ and CD8+ T cell subsets assessed by CCR7 and CD45RA expression in patient II.2 and patient II.3 compared to a healthy control. Percentages of naïve T cells (CCR7+CD45RA+), central memory T cells (CCR7+CD45RA−), effector memory T cells (CCR7−CD45RA−) and TEMRA cells (CCR7−CD45RA+) of CD4+ or CD8+ T cells are indicated by numbers in the respective quadrant.

