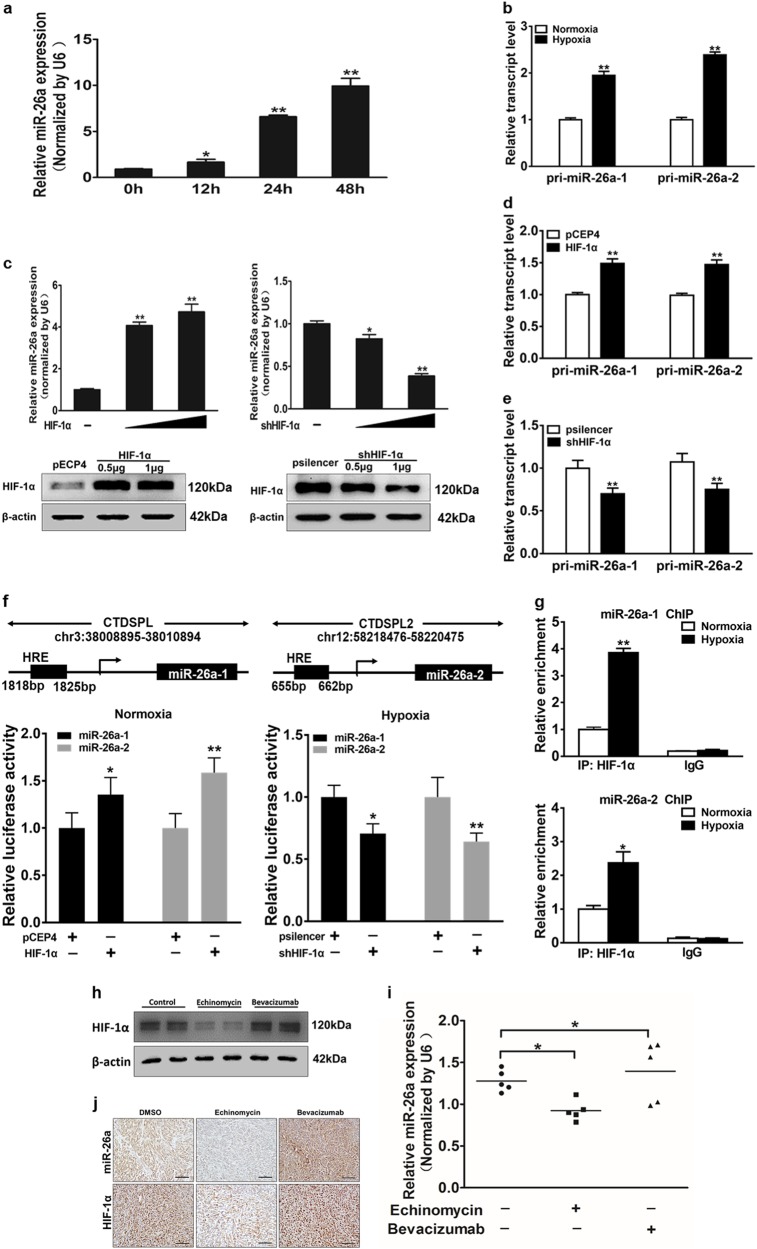
Fig. 2. MiR-26a expression is upregulated under hypoxia through HIF-1α in glioma cells.
a Quantitative real-time PCR (qRT-PCR) was performed to measure time-dependent expressions of miR-26a after exposure to hypoxia for 0, 12, 24, or 48 h. b Measurement of pri-miR-26a-1 and pri-miR-26a-2 among U87MG cells were showed in cells exposed to hypoxia compared with normoxia. c Upper: qRT-PCR was used to detect the expression of miR-26a after transfection. Lower: The HIF-1α protein levels were examined by western blotting to confirm the plasmids transfection efficiency. d, e Expression levels of pri-miR-26a-1 and pri-miR-26a-2 were measured in cells overexpression or interference of HIF-1α. f U87MG cells were respectively transfected with miR-26-1/2 promoter reporter plasmids and pCEP4-HIF-1α or shHIF-1α (psilencer), and relative luciferase activities were determined. g Cells were exposed to normoxia or hypoxia for 24 h. ChIP assay was performed using antibodies against IgG or HIF-1α followed by analysis of qRT-PCR. h Nude mice were inoculated with U87MG cells. And at day 14th after implantation, nude mice were treated with echinomycin (0.12 mg/kg) or bevacizumab (10 mg/kg) every 2 days for 16 days. HIF-1α expression was tested by western blotting to confirm the establishment of the animal models. i Expression levels of miR-26a in tumor masses were measured by qRT-PCR. j HIF-1α and miR-26a levels and locations in tumor tissues were measured by in situ hybridization and immunohistochemistry, respectively. Scale bar = 100 μm. Data were presented by means ± SEM. in triple experiments. Asterisk or hash indicated significant difference at P < 0.05 compared with DMSO group. Double asterisk indicated significant difference at P < 0.01 compared with control group

