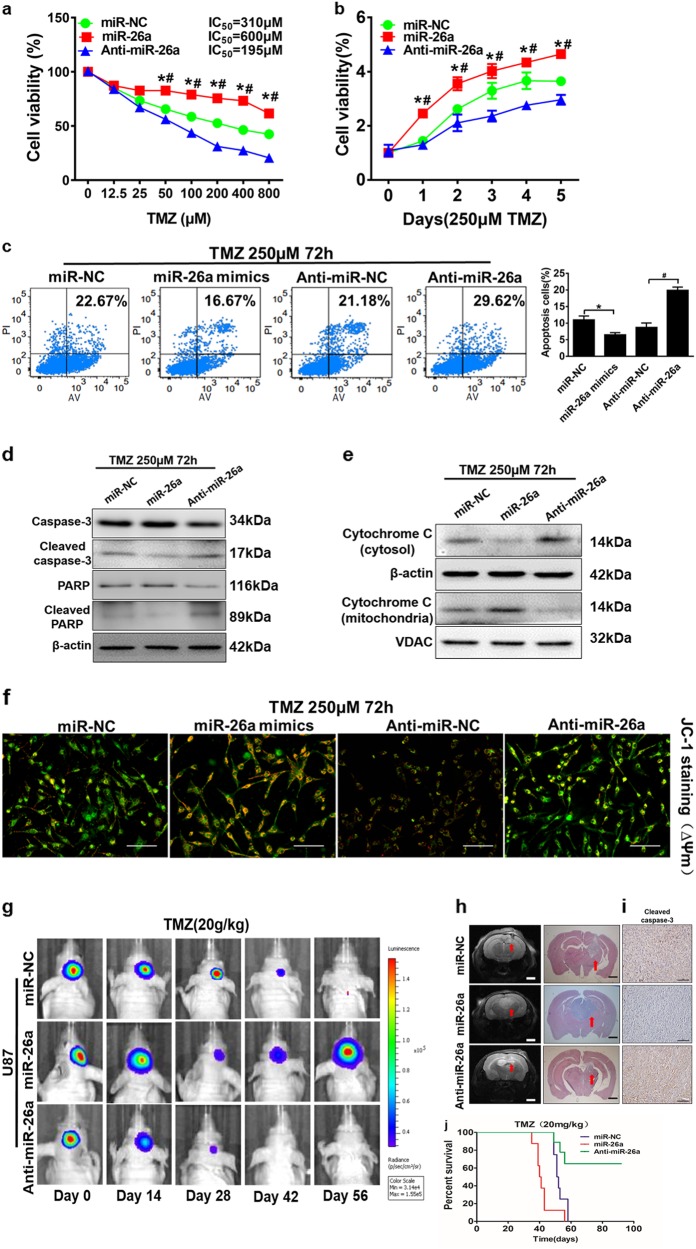
Fig. 3. MiR-26a protects glioma cells mitochondrial function and promotes TMZ resistance in vitro and in vivo.
a) CCK8 assay was performed in U87MG cells stably expressing miR-NC, miR-26a, or anti-miR-26a inhibitor, with TMZ treatments at different concentrations for 72 h. b The cell proliferation in 250 µM TMZ treatments was tested every 24 h in cells respectively. c U87MG cells were transfected with miR-NC, miR-26a mimic or anti-miR-26a inhibitor for 48 h, then subjected to TMZ treatments (250 µM, 72 h). Cell death ratio was detected by ANXA5 and PI staining. The apoptotic and secondary necrotic cells was shown as the sum of ANXA5-positive and ANXA5 and PI double-positive cells. Results were quantified as the percentage of apoptosis ANXA5-positive and ANXA5 and PI double-positive cells in total cells and presented in the right panel. d Caspase-3, cleaved caspase-3, PARP, cleaved PARP protein levels were detected in the stably expressing miR-NC, miR-26a, or anti-miR-26a cell lines. e Western blot analysis showed cytochrome C levels of cytoplasm and mitochondria in the stably expressed miR-NC, miR-26a, or miR-26a-sponge cell lines after TMZ treatments (250 µM, 72 h). β-actin and VDAC levels were served as the internal control of cytoplasmic and mitochondrial proteins, respectively. f U87MG cells transduced with miR-NC, miR-26a mimics or anti-miR-26a inhibitor after treatment with TMZ (250 µM) for 12 h was stained with JC-1 probe and imaged by fluorescent microscope. Scale bar = 100 μm. g U87MG/miR-NC, U87MG/miR-26a, and U87MG/ anti-miR-26a cells (1 × 10⁵ cells) were dispersed in 5 μL of Matrigel and were implanted intracranially in each mouse. Representative pseudocolor bioluminescence images of intracranial mice bearing miR-NC, miR-26a, or anti-miR-26a transduced U87MG cells after treatment with TMZ at indicated time points. TMZ treatment (20 mg/kg) group: n = 12 for miR-NC, n = 10 for miR-26a, n = 10 for miR-26a-sponge. h Intracranial tumors in brain were shown by T2-weighted MRI and H&E staining. Scale bar = 1 mm. i Immunohistochemical (IHC) staining of tumor sections for cleaved caspase-3 signals. Scale bar: 100 μm. j Kaplan–Meier curves were drawn to measure the survival abilities of U87MG stable cell lines. Data were presented by means ± SEM in triple experiments. Asterisk or hash indicated significant difference at p < 0.05 compared with miR-NC or anti-miR-NC

