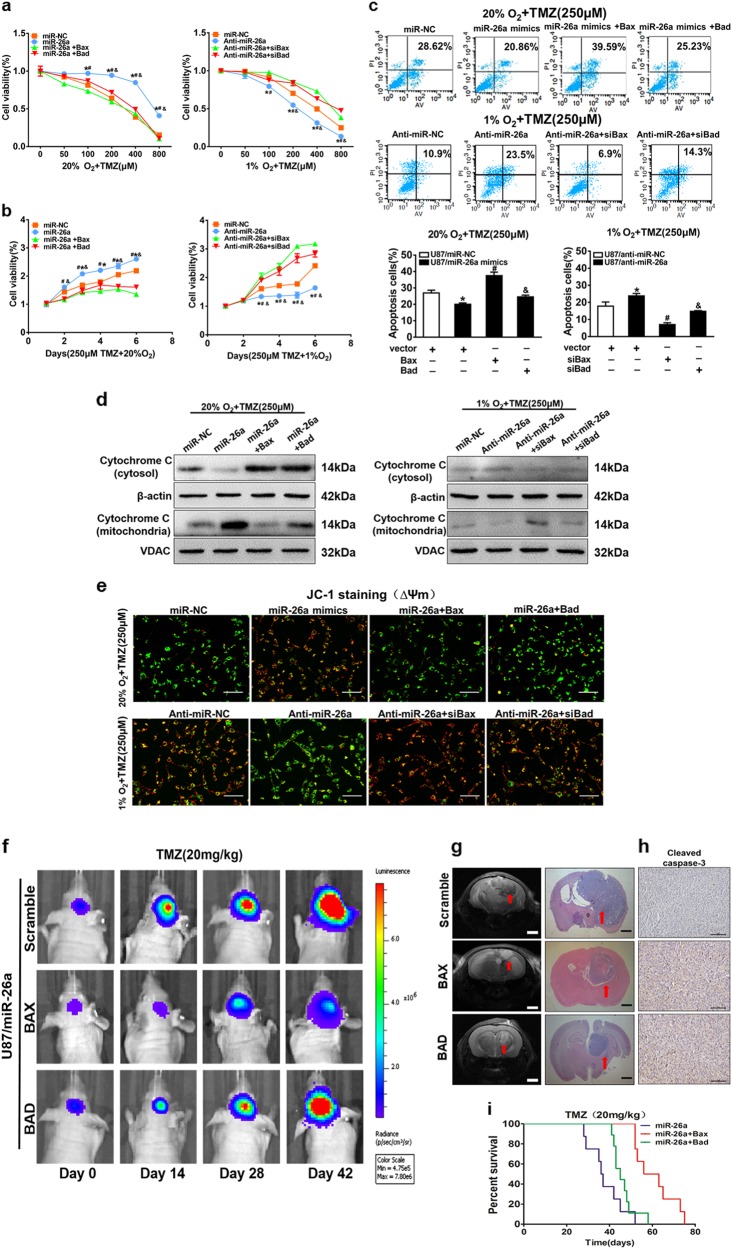
Fig. 5. MiR-26a/Bax/Bad axis contributes to hypoxia-mediated TMZ resistance in vitro and in vivo.
a Cell viability was analyzed by CCK8 assay 48 h after TMZ treatments as indicated. b Cell viability was tested every 24 h for different times with treatment of 250 µM TMZ. c, e Cell apoptosis and mitochondrial membrane potential function were evaluated by flow cytometry and JC-1 probe kit in U87MG cells with co-transfection miR-NC or miR-26a mimics, with or without overexpression of Bax and Bad under normal condition. Meanwhile, U87MG cells with co-transfection anti-miR-NC or anti-miR-26a mimics with or without siBax and siBad under hypoxic condition. U87MG cells exposed to normoxic or hypoxic condition were pretreated with indicated TMZ treatments (250 μM), then subjected to apoptosis assay. Scale bar = 100 μm. d Western blot analysis showed expression levels of cytochrome C in mitochondria and cytoplasm using stably expressing miR-NC, miR-26a, or anti-miR-26ainhibitor with indicated treatment. f Representative pseudocolor bioluminescence images of intracranial mice bearing miR-26a with or without the overexpression of Bax and Bad upon TMZ treatments. Cells were implanted intracranially in each mouse. 10 mouse each group. g T2-weighted MRI and H&E staining of brain sections showed intracranial tumors. Scale bar = 1 mm. h IHC staining of cleaved caspase-3. Scale bar = 100 mm. i Kaplan–Meier curves were drawn to measure mouse survival with the tumor burden induced by U87MG cells stably expressed miR-26a, with or without the overexpression of Bax and Bad. Data are presented as mean ± SEM from three independent experiments. Asterisk indicates significant difference at p < 0.05 compared with control group, hash indicates significant difference at p < 0.05 compared with control group and ampersand indicates significant difference at p < 0.05 compared with control group

