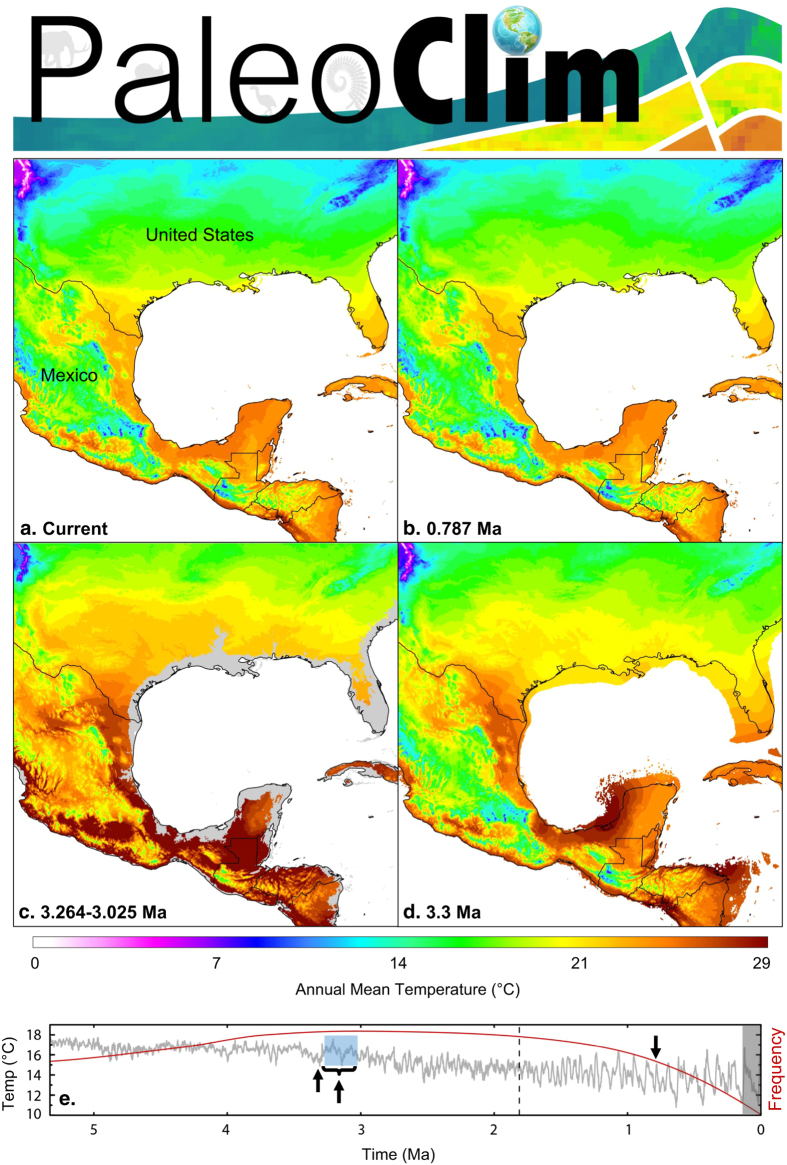
Figure 1. Paleoclim datasets.
(a) Current climate (from CHELSA). (b) Pleistocene MIS19 (ca. 787 Ka). (c) mid-Pliocene Warming Period (3.265-3.025 Ma). Sea-levels were on average 25 m higher than modern times (depicted in gray). The grayed areas are not part of the final corresponding datasets. (d) Pliocene M2 period (3.3 Ma). Sea-level is 40 m lower than current levels and, in many areas, coastlines were expanded. (e) Sea-surface temperature changes (left axis) and speciation rates (right axis) during the last 5 Ma (gray line and red line, respectively. Data from17, 54). Black arrows highlight time periods of this study. The gray box depicts the time periods of high-resolution climate data currently widely available to biologists.

