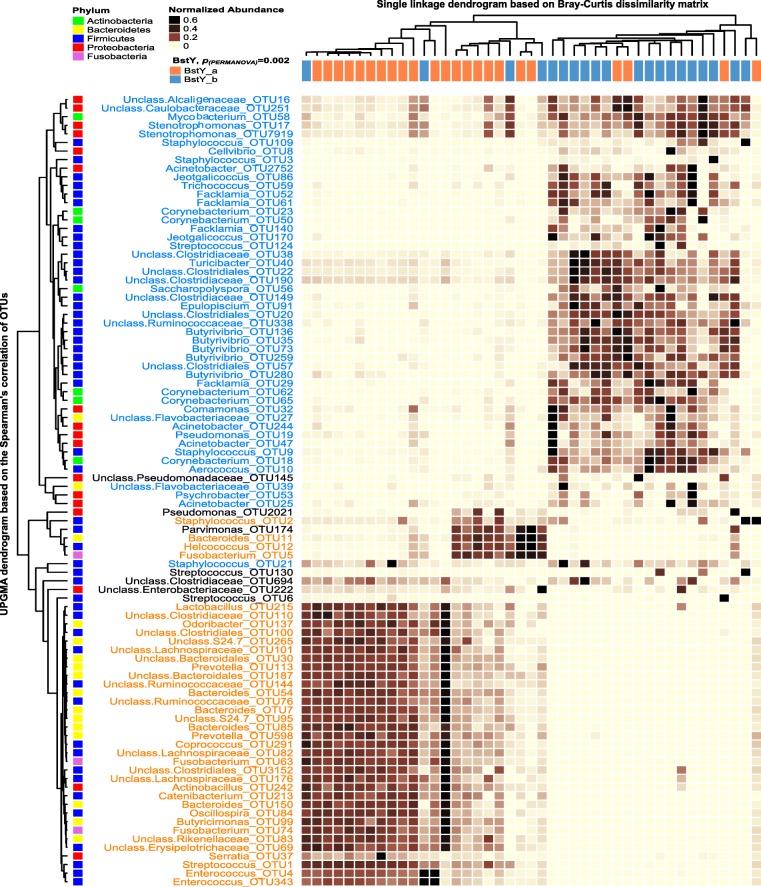
Fig. 6.
Unsupervised cluster analysis of day 0 colostrum samples based on the distribution of bacterial OTUs. Rows correspond to individual bacterial OTUs (relative abundance > 0.1% of the community). Columns correspond to individual samples, color coded based on BoLA-DRB3.2 variants (BstYa) and (BstYb). The “Normalized Abundance” key relates colors to the normalized proportions of OTUs across samples. The top dendrogram shows the result of single-linkage hierarchal clustering of samples based on the Bray-Curtis dissimilarities of their bacterial communities. The left dendogram shows how OTUs correlate (co-occur) with each other based on their Spearman’s correlation coefficient. The “Phylum” key relates the left annotations to the corresponding phylum of each OTU. Color codes have been used to highlight statistically significant associations between the proportion of OTUs and BoLA-DRB3.2 variants (identified using linear discriminant analysis effective size (LEfSe)). Bray-Curtis resemblance matrix was created based on the proportions of the abundant bacterial OTUs and subjected to PERMANOVA (9999 permutations) in order to test the significance of the clustering pattern of samples based on BoLA-DRB3.2 variants

