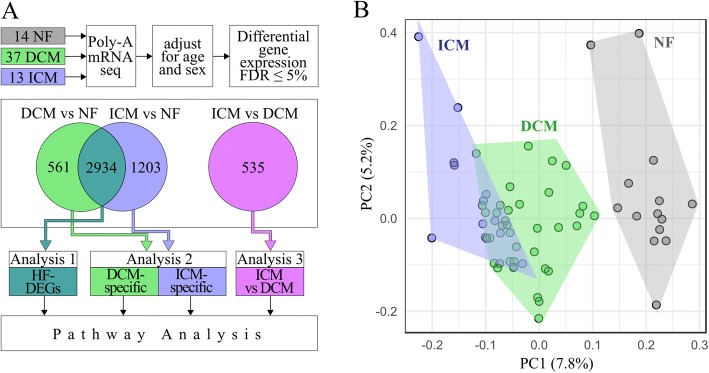
Fig. 1.
Schematic of RNA-seq analyses. a mRNA from 64 human hearts was extracted, sequenced, and adjusted for covariates. By comparing DEGs at an FDR of 5%, three pathway analyses were conducted. Analysis 1 considered all shared DEGs between DCM vs NF and ICM vs NF as HF-DEGs (green-blue). Analysis 2 considered non-overlapping DEGs as DCM-specific (green) or ICM-specific (blue). Analysis 3 directly compares diseases (pink). b Principal component analysis of all three cohorts, ICM (blue), DCM (green), and NF (grey). On the first two principal components, each of the three groups clusters together with overlap between ICM and DCM. ICM clusters further away from NF than DCM

