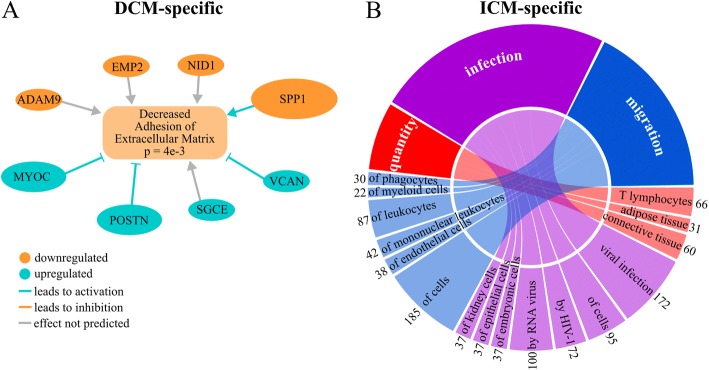
Fig. 5.
Pathway analysis in disease-specific DEGs. a Network of genes involved in the predicted decrease of extracellular matrix adhesion in DCM. The absolute fold change of each gene is indicated by the size of its oval. b Circos plot of predicted activated biofunctions in ICM for three categories: quantity, infection, and migration. Connection sizes correlate to the number of genes involved in each sub-category, which are listed on the outside of the circle

