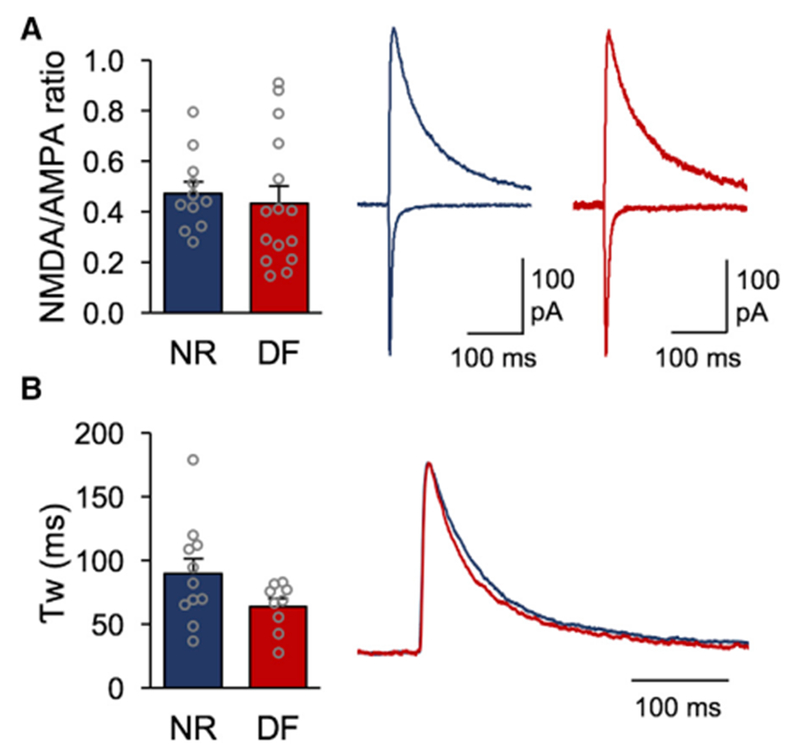
Figure 2. Regulation of NMDAR Function at TC Synapses onto Adult V1 L4 Neurons following Deafening.

(A). Left: NMDA/AMPA ratio measurements for the NR and DF groups (open circles represent individual cells; NR = 0.49 ± 0.045, 4 mice; DF = 0.43 ± 0.067, 5 mice; t test, N.S. p = 0.5173). Right: averaged example traces for an NR cell (blue) and DF cell (red) normalized to the AMPAR component in NR. The AMPAR component was measured at the peak recorded at −80 mV, while the NMDAR component was measured 70 ms after the onset of the compound EPSC recorded at +40 mV.
(B). Left: weighted decay time constant (Tw) for a pharmacologically isolated NMDAR current measured at +40 mV for the NR and DF groups (open circles represent individual cells; NR = 89.31 ± 11.97 ms, 4 mice; DF = 63.93 ± 6.3 ms, 3 mice; t test, N.S. p = 0.0961). Right: averaged NMDAR responses for the NR (blue) and DF (red) groups normalized to the maximum amplitudes.
Bar graphs: mean ± SEM.
