
Fig. 2.
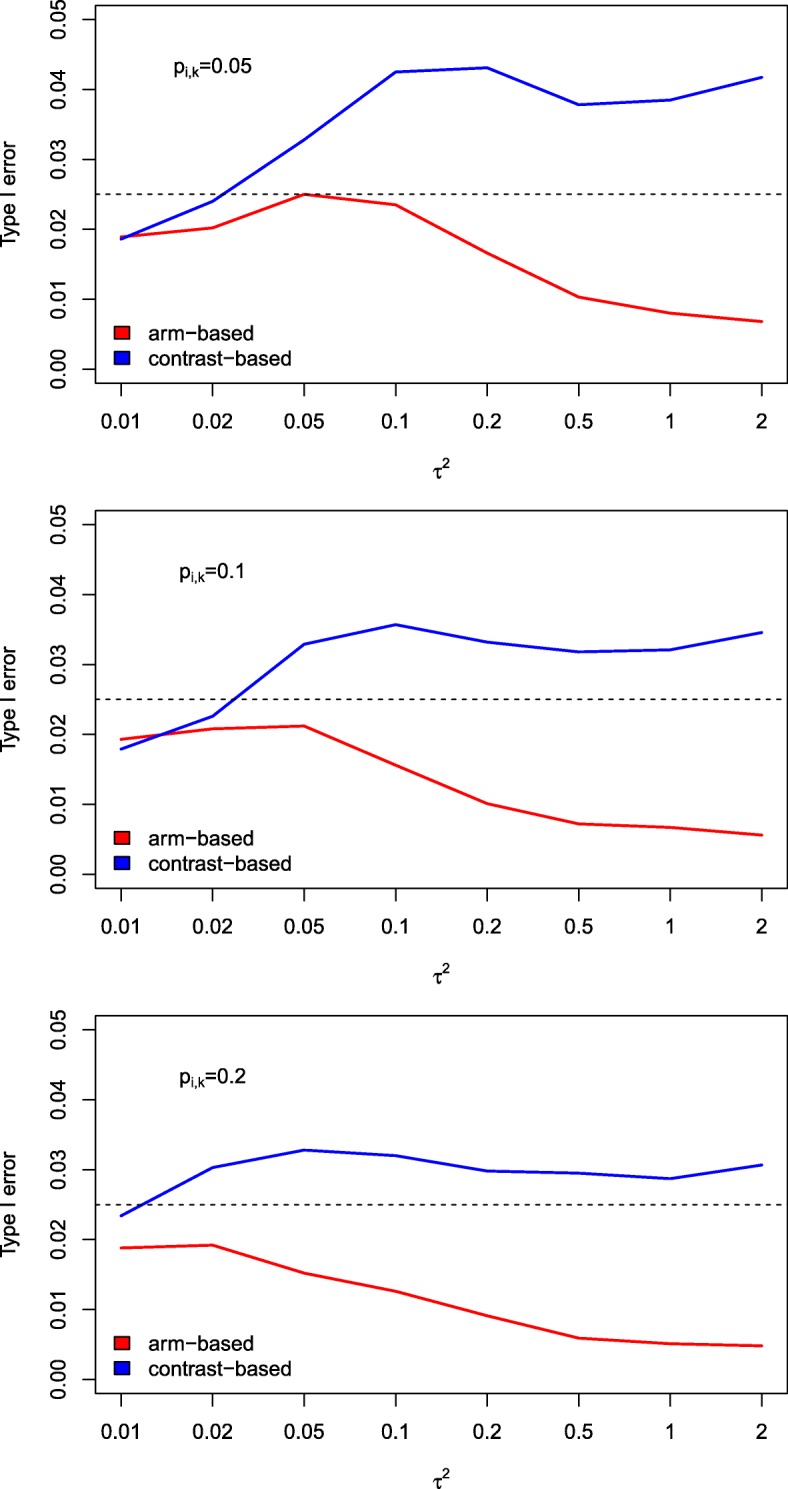
Simulated type I error rates (heterogeneity). Simulated type I error rates for varying values of τ2 (based on 10,000 runs). The sample size per treatment arm and the success rate were kept fixed at Nik=500 and pik=0.05,0.1,0.2, respectively (i=1,…,16, k=P,S,E), while Δ was set to 0