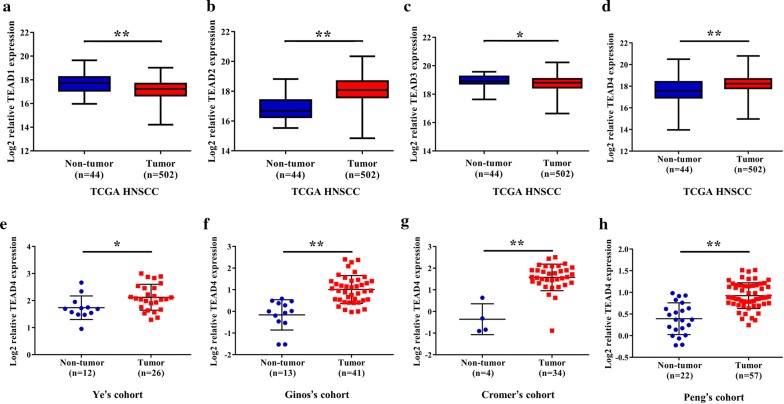
Fig. 1.
Overexpression of TEAD1-4 mRNA in HNSCC cohorts. The mRNA levels of TEAD1-4 (log2-transformed) were compared between HNSCC samples and normal counterparts in multiple patient cohorts. a–h The original data were retrieved from Oncomine database and TCGA and then plotted using GraphPad Prism 7 software. Y-axis represents the median intensity, 25th and 75th percentile data. *P < 0.05; **P < 0.01; ns, not significant; Student’s t test or Mann–Whitney U test as appropriate

