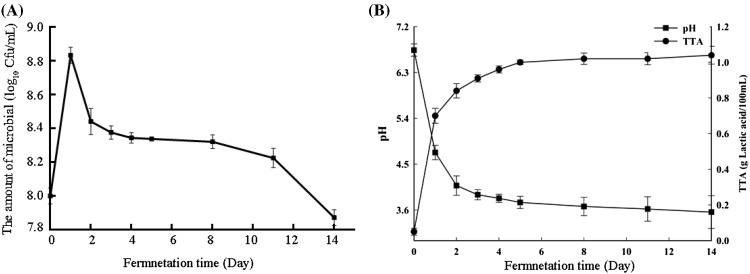
Fig. 1.
The amount of microbial (lactic acid bacteria) (A), pH and total titratable acidity (B) during fermentation of the vegetable–fruit beverage. The average from the three plates recorded for each serial dilution. Results represent the means of three independent trials (n = 3). Error bars represent standard deviation values

