
Fig. 2.
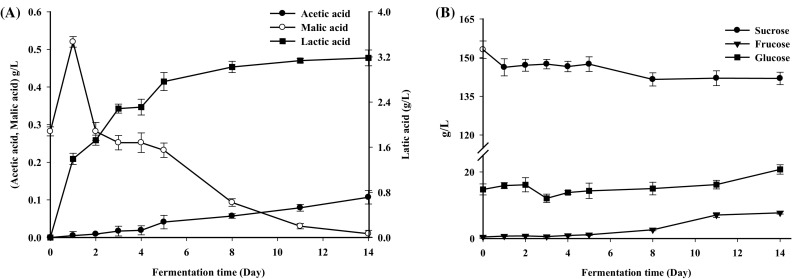
Changes of organic acid and sugar levels during fermentation of the vegetable–fruit beverage. (A) Represents lactic acid, acetic acid, and malic acid. (B) Represents sucrose, fructose, glucose. Results are the means of three independent trials (n = 3). Error bars represent standard deviation values