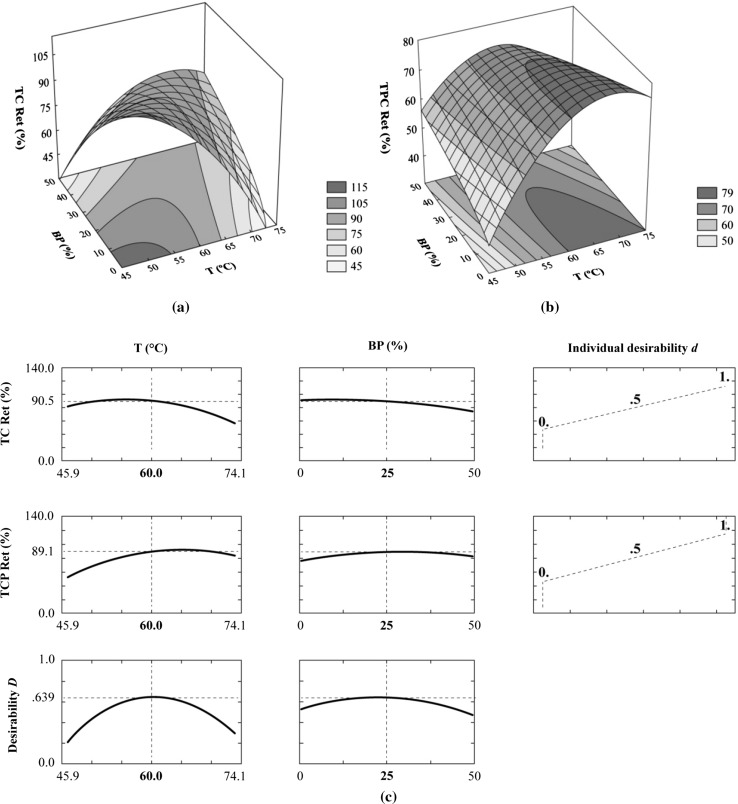
Fig. 1.
Response surface plot of total carotenoid retention (TC Ret, %), b response surface plot of total phenolic compound retention (TPC Ret, %). c Profiles for predicted values of total carotenoid retention (TC Ret, %) and total phenolic compound retention (TPC Ret, %), individual desirability functions () and overall desirability (D), all of them as a function of the temperature (T, °C) and percentage of guava by-products (BP, %)

