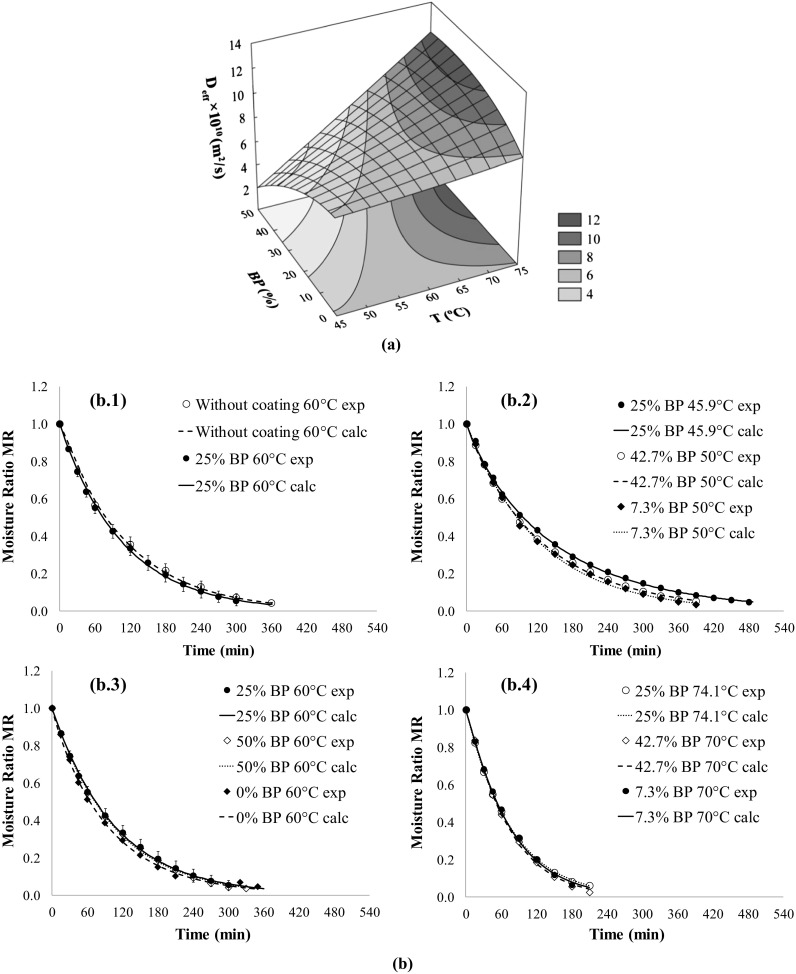
Fig. 2.

a Response surface plot of diffusion coefficients () as a function of the drying temperature (T, °C) and percentage of guava by-products (BP, %). b Comparison between moisture ratio content (MR) observed and calculated, according to the empirical models as a function of drying time of guava slices subjected to different treatments: b.1 coated with 25% BP and non-coated, dried at 60 °C, b.2 coated with different BP concentrations and dried at lower temperatures (50 °C and 45.9 °C), b.3 coated with different BP concentrations and dried at 60 °C, b.4 coated with different BP concentrations and dried at higher temperatures (70 °C and 74.1 °C)
