
Figure 3.
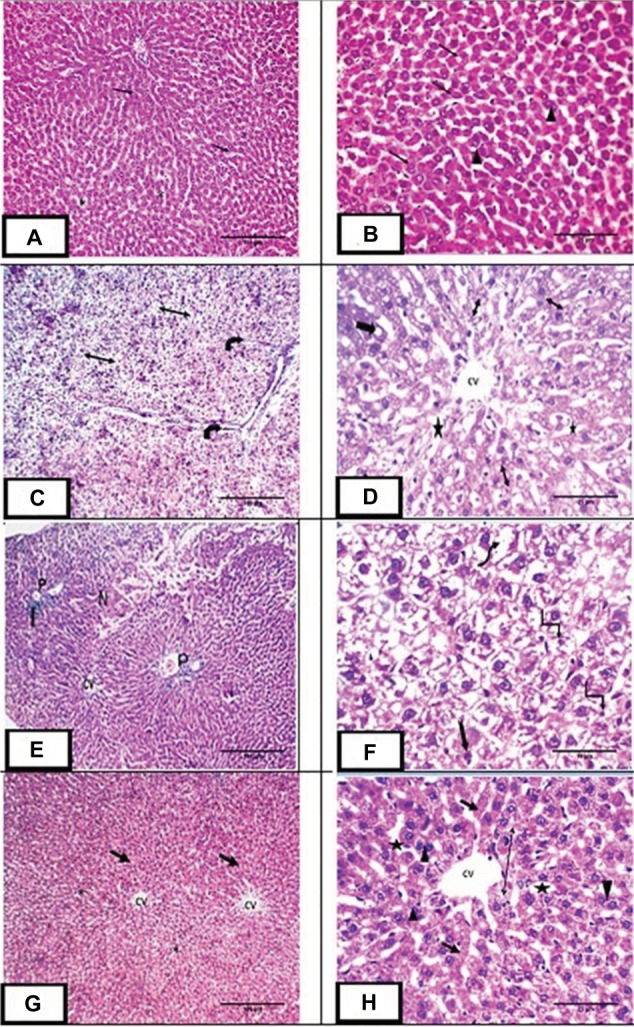
H&E staining of liver sections:
Notes: (A,B) Photomicrograph of liver sections of control group showing central vein (CV) surrounded by plates of polyhedral hepatocytes (arrow) with central rounded vesicular single or double nuclei (arrowhead). The spaces between cells are hepatic sinusoids (star). (C,D) Photomicrograph of liver sections of methotrexate treated group showing loss of architecture with thin few septa of portal fibrosis (curved arrow) and hepatic steatosis in the form of foamy appearance of the hepatocytes. Some hepatocytes demonstrate microsteatosis (double head arrow) and macrosteatosis (thick arrow). Dilated central vein (CV) surrounded by dilated hepatic sinusoids (*) were also observed. (E,F): Photomicrograph of liver sections of the same group showing central vein (CV), loss of architecture, necrosis (n) and cellular infiltration (I) at the portal area (P). The highly vacuolated hepatocytes exhibit nuclear pleomorphism (uneven size of the nuclei), karyolysis (wavy arrow), pyknosis (angled arrow), karyorrhexis (notched arrow). (G,H): Photomicrograph of liver sections of group III showing central vein (CV) surrounded by plates of hepatocytes (arrow) with central rounded single or double nuclei (arrowhead). Dilated hepatic sinusoids are seen between strands of hepatocytes (star). Some hepatocytes show microsteatosis (double head arrow). Magnification: (A, C, E & G) ×100, scale bar =100µm; (B, D & H) ×400, scale bar =25µm; (F) ×1000, scale bar =10µm.