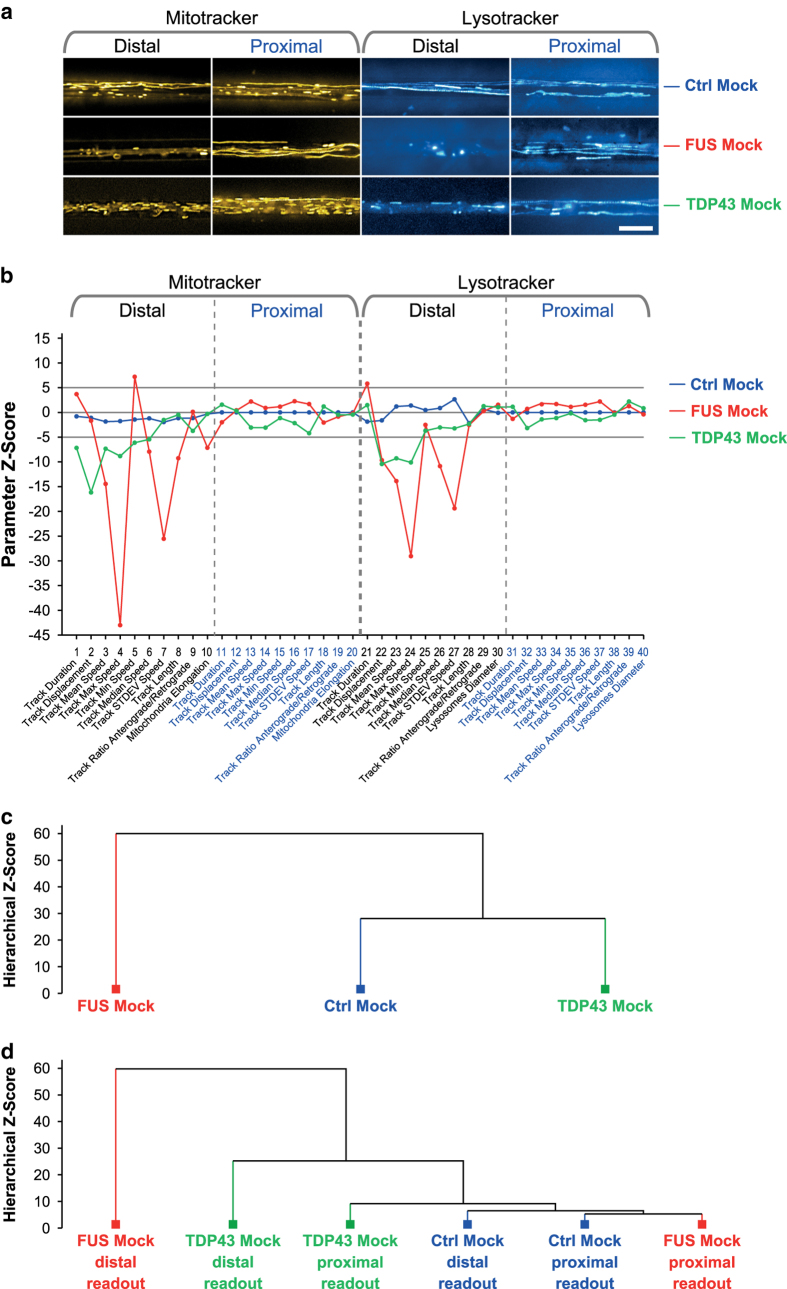
Figure 3. Validation of multiparametric HC profiling through disease models with confirmed axonal trafficking defects.
(a) Maximum intensity projections of movie raw data acquired live with mitotracker (left) and lysotracker (right) at the distal (left) versus the proximal (right) microchannel readout position (Fig. 1). Note the virtual organelle arrest in the FUS (red) and TDP43 (green) mutants at the distal MFC readout site (loss of straight trajectories compared to Ctrl Mock above) whereas proximal motility remained unaltered. Scale bar = 10 μm. (b) Multiparametric HC signatures corresponding to (a). Note the nearly unaltered trafficking of both mutants at the proximal MFC readout site as compared to Ctrl Mock (blue) as opposed to strong negative parameter deviations at the distal site in FUS (red) distinct from the more modest phenotype of TDP43 (green). (c) Hierarchical cluster dendrogram of entire signatures in (b). Note how the modest TDP43 mutant (green) clustered with Ctrl Mock (blue) against the phenotypically more distinct FUS mutant (red). (d) Hierarchical cluster dendrogram of partial signatures comprising either only all distal or proximal parameters to compare site – specific phenotypes. Note how both physiological Ctrl Mock parts (blue, distal and proximal) clustered closely with the proximal FUS Mock part (red) on the right due to the close physiological trafficking state whereas the drastic organelle arrest in the distal FUS Mock part on the far left (red) was highly distinct to the physiological parts at the proximal site. TDP43 showed some moderate deviation in its proximal part (green) from the physiological clusters (Ctrl Mock, blue, and FUS Mock proximal, red) and a clear deviation in its distal part (green), albeit less drastic than FUS Mock (red).

