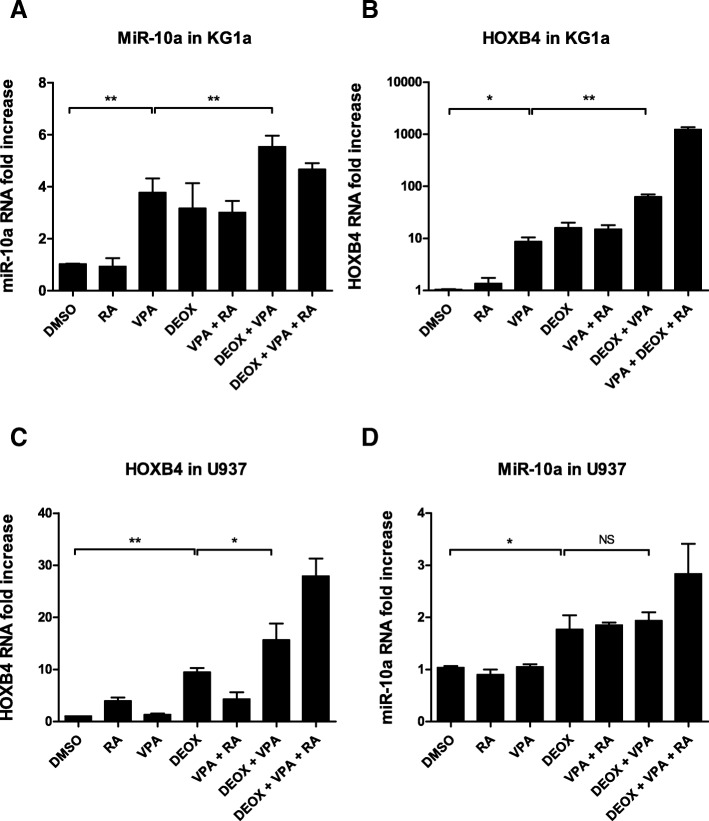
Fig. 2.
Expression of HOXB4 and miR-10a in cell lines according to treatment by 5-aza-2’deoxycytidine (DEOX), valproic acid (VPA), and retinoic acid (RA). KG1 (a, b) and U937 (C, D) were treated with 2 μM 5-aza-2’deoxycytidine (DEOX) and/or 1 mM valproic acid (VPA) for 48 h and/or 2 μM retinoic acid (RA) for 4 h. After RNA extraction, quantitative RT-PCR measured the relative expression miR-10a with RNU6–1 as a control gene (a, d) and of HOXB4 with TUBA1C and RPLP0 both used as control genes (b, c). The graphs show fold induction of gene expression by treatment over DMSO control with mean ± SEM (n = 3). *, p < 0.05; **, p < 0.01; ***, p < 0.001; NS, non-significant

